❄️“END of Snow?” @NYTimes (2014) ❄️“RESORTS could lose up to 40% of snow by 2020” @CSIRO (2003) ❄️SNOW “will become a very rare & exciting event. Children just aren’t going to know what snow is” Dr.Viner (2000) ❄️“DECREASE heavy snowstorms” @IPCC_CH (2001) climatism.wordpress.com/2019/11/18/sno
A chance to counterbalance a few of the ‘rapid warming’/’boiling planet’ summer outbursts of climate obsessives. The BBC says a weather station in …
Paul Driessen, one of the finest climate (scam) journalists.
No exceptions in this eye-opening and on-point article on the farcical machinations of the unelected, unsackable, taxpayer funded, bureaucratic leviathan—the evil and wholly misanthropic United Nations.
By Paul Driessen ~ This year’s UN Climate Change Conference, known as COP-28, just sputtered to a predictable close. In many ways, it was much like …
“Policymakers at COP28 need to get out of the way of companies that are harnessing energy responsibly and innovatively and recognize the need to pave the way for a legacy of human advancement worldwide. In energy lies not just the power to create but also the power to conserve and protect all that has been created.”
By Miles Pollard ~ As the international climate conference known as the Conference of the Parties, or COP28, starts the first Global Stocktake—a …
How many climate™️ lies, falsehoods, and alarmist dud-predictions will it take for society to wise up to what is the greatest and most costly scam ever perpetrated against mankind?
❄️“END of Snow?” @NYTimes (2014) ❄️“RESORTS could lose up to 40% of snow by 2020” @CSIRO (2003) ❄️SNOW “will become a very rare & exciting event. Children just aren’t going to know what snow is” Dr.Viner (2000) ❄️“DECREASE heavy snowstorms” @IPCC_CH (2001) climatism.wordpress.com/2019/11/18/sno
Electroverse reports NH Snow Mass 250 Gigatons Above 1982-2012 Average. Excerpts in italics with my bolds. Northern Hemisphere snow mass is enjoying…
“But there is another reason why we will probably never have to worry about methane being a major contributor to global warming: Methane’s narrow absorption bands, at 3.3 microns and 7.5 microns , perfectly match…water’s! Did you catch that? It’s worth emphasizing: “The ratio of the percentages of water to methane is such that the effects of methane are completely masked by water.”
Indeed.
METHANE (CH4) is an unstable gas which oxides quickly in the atmosphere. It occupies less than 2PPM of the atmosphere, and its absorption bands almost completely overlap with H2O. Even a very large increase in CH4 would have ‘NetZero’ impact on climate.
“To get the same amount of energy from solar and wind that we now get from fossil fuels, we’re going to have to massively increase mining.
By more than 1000%.
This isn’t speculation. This is physics.”
This post is well worth your time, either through viewing the video presentation, or for a more devastating effect, via the transcript.
How an ideology can take such a fervent foothold and do so much damage to civilisation, at rapid pace, is perhaps, an inferior question to how the physics of UNreliables were/are so casually overlooked as to render current civilisation, inoperable.
Are we heading toward an all-renewable energy future, spearheaded by wind and solar? Or are those energy sources wholly inadequate for the task? Mark Mills, Senior Fellow at the Manhattan Institute and author of The Cloud Revolution, compares the energy dream to the energy reality.How Much Energy Will the World Need?
Video Transcript
We’re headed toward an exciting all-renewable energy future. Wind and solar will power the world of tomorrow.
And tomorrow isn’t far off!……..
…It’s time to wake up.
You’re having a dream.
Here’s the reality.
Oil, natural gas, and coal provide 84% of all the world’s energy. That’s down just two percentage points from twenty years ago.
And oil still powers nearly 97% of all global transportation.
Contrary to headlines claiming that we’re rapidly transitioning away from fossil fuels, it’s just not happening. Two decades and five trillion dollars of governments “investing” in green energy and we’ve…
“Isn’t the only hope for the planet that the industrialized civilizations collapse? Isn’t it our responsibility to bring that about?” – Maurice Strong, founder of UNEP
“Renewable energy technologies simply won’t work; we need a fundamentally different approach.” – Top Google engineers
“Suggesting that renewables will let us phase rapidly off fossil fuels in the United States, China, India, or the world as a whole is almost the equivalent of believing in the Easter Bunny and Tooth Fairy. – James Hansen (Former NASA-climate chief)
•
‘Green’ Germany is considering support for at least 10 foreign ‘dirty’ fossil fuel projects worth over €1 billion ($1.5B AUD), despite its pledge to end international funding for coal, oil and gas.
Nothing like an energy crisis to change sentiment!
Germany is considering support for at least 10 foreign fossil fuel projects worth over €1 billion ($1bn), despite its pledge to end international funding for coal, oil and gas.
In response to a parliamentary question from a left-wing German lawmaker, the state secretary at the ministry of economic affairs and climate action Udo Philipp said the government is considering 10 applications for export credit guarantees for fossil energy projects in Brazil, Iraq, Uzbekistan, the Dominican Republic and Cuba.
A breakdown of the projects accompanying the response shows that €419 million ($442m) or around 40% of the funding, could go to a single project in Brazil. Three of the projects totalling €340m ($359m) are located in Iraq and four are in Cuba.
Other fossil fuel projects could be under consideration by the German state-owned investment and development bank KfW. The bank does not disclose projects it hasn’t decided to support.
Germany was among 16 countries to sign a pledge at Cop26 in Glasgow last year to end international funding for fossil fuel projects by the end of 2022.
Ten have published policies showing how they will restrict funding to coal, oil and gas. But Germany has not adopted a policy because of internal divisions over exemptions for gas.
Reality bites.
And, how many more taxpayer-trillions need to be torched at the alter of ClimateChange™️, scarring the land with useless, industrial eco-crucifixes and mirrors, before the suicidal ‘fog of Green’ clears?
Drax power station, generating 7% of Britain’s needs, is partly converted to burning imported woodchips. Staying warm, or even alive, takes priority over tedious climate dogma. Energy policy related to electricity generation is exposed as pitifully inadequate when the wind dies down and the days are short. The demise of cold spells in winter has been greatly exaggerated.
– – –
Emergency plans to fire up old coal plants have been triggered by National Grid as cold weather sparked fears of a supply shortage, says Energy Live News.
Two coal-fired generation units at Drax power station in Yorkshire have been instructed to be warmed up and ready for potential usage today.
Go woke, go broke.
Corporations, slowly beginning to realise that slavish adherence to ClimateChange™️ ideology will cripple their own interests, too.
It’s the irreparable damage being done to the poor and middle class–who fund it all–that is of actual concern, IMO.
How long the MainstreamMedia™️ continues their “climate crisis” fantasy/narrative is where the rubber meets the road. It is *all* in their hands, unfortunately.
Crazy world of climate finance [image credit: renewableenergyfocus.com] Finance giants don’t like hefty fines for exaggerating their supposed climate virtues, or law suits for not acting in the best interests of their clients. Solution: leave their net-zero climate club.
– – –
Vanguard, the world’s second-largest asset manager, announced that it is resigning from a global net-zero initiative.
. . .
Shortly before COP26, last year’s United Nations climate conference in Glasgow, financial institutions were rushing to announce their climate commitments, says Grist (via Gizmodo).
The conference’s leadership and Mark Carney, a special envoy appointed by the United Nations to push private finance to invest in climate solutions, announced the creation of the Glasgow Financial Alliance for Net-Zero, or GFANZ.
Don’t they all end with “unrealistic declarations” to allow room for themselves for the next COP, and the next, and the next…?
Why solve a ‘problem’ when the problem is the solution?
“The Conference of the Parties…Highlights that about USD 4 trillion per year needs to be invested in renewable energy up until 2030 to be able to reach net zero emissions by 2050.”
Therefore it is really time for us all to stop taking any of the information broadcast out of the annual United Nations climate conferences called Conference Of The Parties seriously. The 27th such conference which convened in Egypt this month concluded with the following statement.
“The Conference of the Parties…Highlights that about USD 4 trillion per year needs to be invested in renewable energy up until 2030 to be able to reach net zero emissions by 2050.” That which would eliminate all life on earth that depends on carbon dioxide which is all life on earth.
This does not include reparations for loss and damage. That potentially much greater financial flow (as it is called in UN speak) is extra.
The precise nature of this called for transformation of the financial system is not specified but easy money seems…
The severe weather forecast Europe says we are likely to have a cold early winter. The blog authored by Renato R Colucci, makes these forecasts: (click to enlarge charts)
“Snow Extent in the Northern Hemisphere now Among the Highest in 56 years Increases the Likelihood of Cold Early Winter Forecast both in North America and Europe.”
“Snow extent in the Northern Hemisphere at the end of November represents an important parameter for the early winter forecast. This year snow extent is running much higher than average and according to existing global estimates, it is now beyond the highest ever observed so far. Winter forecast, especially in its early phase and in Europe, might be strongly influenced by such a large snow extent, although many other factors need attention.” (My emphasis on sentence,)
The posting also shows that fall snow extent is increasing lately. The following charts show the trend.
It was never really about climate or the weather, was it. ‘The Environment’ merely the emotional ruse necessary to guilt you into unquestioning obedience, compliance, faith, and belief.
New York Times climate reporter Cara Buckley issued a weirdly casual “news” profile of the “gentle” leader of a radical anti-humanity movement called Voluntary Human Extinction, datelined (naturally) Portland, Oregon, under the admirably honest headline: “Earth Now Has 8 Billion Humans. This Man Wishes There Were None.” So enthusiastic was Buckley that this sentence was included in her online byline: “Buckley interviewed Mr. [Les] Knight in Portland and was surprised to find him curiously uplifting.”
The praise for the humanity-loathing human began at the start. Not even Tucker Carlson could hamper Knight’s good vibes.
For someone who wants his own species to go extinct, Les Knight is a remarkably happy-go-lucky human.
He has regularly hosted meteor shower parties with rooftop fireworks. He organized a long-running game of nude croquet in his backyard, which, it should be mentioned, is ringed by 20-foot-tall laurel hedges. Even Tucker…
Estimated “loss and damages” from human caused climate chaos:
India $6.6 trillion a year
Brazil $5.1 trillion a year
Mexico $2.9 trillion a year
Indonesia $2.5 trillion a year
Argentina $1.6 trillion a year
Iran $1.1 trillion a year
Perhaps the more logical question would be, how much “loss and damage” would have been incurred without fossil fuel proliferation throughout the western and developing worlds?
This preposterous claim shows the dangerous absurdity of the “loss and damage” doctrine. At this rate of damage the global total would run around TWO HUNDRED TRILLION DOLLARS A YEAR. There is not that much money in the whole world.
The $800 billion a year is from a report presented by Colombia at COP27. The mainstream green press either did not notice or decided to ignore it, lest it raise issues best left alone until the proposed UN Loss and Damage Facility is created.
Look at it this way. Colombia is a relatively small country with a GDP of around $300 billion a year, about the 40th largest in the world and just 0.4% of the global total. Its “loss and damage” claim is roughly 2.5 times its GDP, so let’s assume that ratio globally.
World GDP is about $81 trillion, which multiplied by 2.5…
“Truth always comes out. It’s one of the fundamental rules. And when it does it can set you free or it can end everything you’ve fought for.” – Chris Holliday
“The common enemy of humanity is man. In searching for a new enemy to unite us, we came up with the idea that pollution, the threat of global warming, water shortages, famine and the like would fit the bill. All these dangers are caused by human intervention, and it is only through changed attitudes and behaviour that they can be overcome. The real enemy then, is humanity itself.“ – Club of Rome, premier environmental think-tank, consultants to the United Nations
“Isn’t the only hope for the planet that the industrialized civilizations collapse? Isn’t it our responsiblity to bring that about?” – Maurice Strong, founder of the UN Environment Programme (UNEP)
•
The one benefit of having a dementia-ridden puppet residing in the Whitehouse is that it will often say the quiet things out loud.
Snowfall will become “A very rare and exciting event… Children just aren’t going to know what snow is.” Dr David Viner – Senior scientist, climatic research unit (CRU)
“Resorts could lose up to 40% of snow by 2020” – @CSIRO (2003)
“Winters with strong frosts and lots of snow like we had 20 years ago will no longer exist at our latitudes.” – Professor Mojib Latif (2000)
This is how WeatherZone.com–unlikely sceptics of the Catastrophic Anthropogenic Global Warming (CAGW) religion–opened their article reporting on extremely rare, if not unheard of, avalanches in Victoria in November.
Their overt surprise not out of context.
Climate models from the 1970s have consistently predicted that CO2-induced global warming climate change should be causing a significant decline in total snow cover. However, global snow cover has actually increased since at least the start of the record (Connolly et al., 2019), leading to some scepticism within the scientific community about the validity of UN IPCC climate models that directly drive costly global warming climate change catastrophism.
Perhaps that same healthy scepticism may well increase, amongst academics and mainstream media institutions, thanks to global warming climate change narrative-contradictions like ‘Avalanches in Victoria in November!’
Though, don’t hold your breath. The ClimateChange™️ eco-scare is strong and will not die quickly. Too many jobs, reputations, taxpayer trillions, and egos are now at stake.
We’ve seen snow fall in late spring and even in summer on the Australian mainland. We’ve also seen Aussie winter snow so heavy that it caused avalanches – a hazard more commonly associated with much more mountainous countries, but which does happen here. There have even been fatalities over the years.
But we’ve never seen an out-of-season snowfall with heavy enough accumulation to cause a significant snow slide. Until now.
Snowy Mountains local Steve Smith (not a great cricketer but definitely a better skier than his famous namesake) got up early on Wednesday morning to take advantage of the unseasonable snowfalls, which you can read about here and here.
No ski lifts are open at this time of year, so he drove up towards the Charlotte Pass ski resort, where he hiked up the slopes of Mt Guthrie to earn a few turns on about 30 to 40 cm of fresh November snow.
Image: Avalanches were definitely not on our weather bingo card for Novrmber. Source: Steve Smith.
That’s when trouble struck. As he started skiing down, the snowpack broke away from itself and started sliding in large chunks, triggered by his skis. Look carefully and you can see his tracks to the right of the slide in the image above.
Below is a shot of the same slide from a different angle.
Image: Stay safe out there, folks, this can happen to you. Source: Steve Smith.
Frighteningly, Steve was caught in the slide but as he told Weatherzone, “I just relaxed and rode it out for a few seconds. No big deal. Pretty gentle terrain in there.”
For the record, Steve is an experienced back country skier who has had avalanche training. He skis with a full safety kit, and so should you if you ever venture out to the back country in any season.
But it was still a lucky escape, as avalanches can bury you even on gentle terrain like the terrain in the images above.
“Take care out there,” Steve warned his fellow back country adventurers who will doubtlessly be heading out in flocks in coming days before this November snow melts.
“Out on the higher alpine terrain, I reckon the avalanche risk is real for a few days till it settles down.”
Image: Same avvy, from a slightly different angle. Source: Steve Smith.
If you do happen to be heading to the high country of Victoria and NSW this weekend for any reason, the forecast is for cool, partly cloudy weather with the chance of a light shower or two (of rain, not snow), especially on Sunday.
“We get a tax credit if we build a lot of wind farms. That’s the only reason to build them. They don’t make sense without the tax credit. –– Warren Buffett
“Renewable energy technologies simply won’t work; we need a fundamentally different approach.” –– Top Google engineers
•
The ultimate irony of ironies?
After spending upwards of half a trillion euros of taxpayers money on useless UNreliables (windmills and mirrors), ‘green’ Germany is now resorting to bulldozing an Energiewende wind ‘farm’ in order to expand a ‘dirty’ brown (lignite) coal mine to keep the lights on.
What a hot mess this ‘green’ ideology has now become.
German energy company RWE has begun dismantling a small wind farm to make way for the expansion of an adjacent lignite coal mine, a move the company willingly acknowledges as “paradoxical”.
RWE has already dismantled one of the wind turbines at the Keyenberg wind park in the western German state of North Rhine-Westphalia. The remaining seven turbines are expected to be dismantled throughout next year, as RWE expands its operations at its Garzweiler coal mine.
“We realize this comes across as paradoxical,” RWE spokesperson Guido Steffen said in a statement. “But that is as matters stand.”
The driving factor behind the decision is the fear of energy shortages driven by the Russia invasion of Ukraine, and the lack of imported fossil gas from Russia.
RWE decided in late-September to reactivate three coal-fired power plants that were previously on standby. The three plants, each with a capacity of 300MW, would resume operations “to strengthening the security of supply in Germany during the energy crisis and to saving natural gas in electricity generation.”
Southeast Australia’s bushfire crisis culminated in the devastating bushfire season of 2019 and 2020 that burnt nearly 25 million hectares of bush.
Our new research demonstrates how the scale of this disaster blew out due to legislation introduced in the 1970s, which was based on idea that nature should be left to grow freely without human intervention.
We investigated the bushfire history of one of the worst hit areas: Buchan on Gunaikurnai Country in Victoria.
We found no bushfires burned there for almost a century until the mid 1970s, following the establishment of the Land Conservation Act of 1970—legislation that sought to protect the Australian bush from humans.
This legislation banned farmers from mimicking Aboriginal burning practices by using frequent fires to promote grass for livestock. As a result, the amount of flammable trees and shrubs exploded in the region.
It was only after this prohibition on burning that catastrophic bushfires became an issue in the Buchan area.
The prolonged neglect of southeast Australian forests under the guise of conservation means our forests now carry dangerous levels of fuels.
“Renewable energy technologies simply won’t work; we need a fundamentally different approach.” – Top Google engineers
“Suggesting that renewables will let us phase rapidly off fossil fuels in the United States, China, India, or the world as a whole is almost the equivalent of believing in the Easter Bunny and Tooth Fairy. – James Hansen (Former NASA-climate chief)
“It is so easy to be wrong —and to persist in being wrong— when the costs of being wrong are paid by others. – Thomas Sowell
•
If there was ever a better (scientific) advertisement for the uselessness of UNreliables (wind and solar) then it is this.
According to economist Jeff Currie of Goldman Sachs, over the past decade, nearly four-thousand-billion-dollars of taxpayer money has been spent on windmills and mirrors to reduce fossil fuel energy consumptionby 1 percent from 82 to 81 percent of overall global energy consumption.
How many more pristine landscapes, wildlife, and taxpayer bank accounts need to be decimated to realise the fanciful “NetZero2050” target, or even a 10% “transition” toward industrial wind and solar?
The mind boggles.
CNBC Squawk Box:
"At the end of last year, overall fossil fuels represented 81% of energy consumption. 10 years ago, they were at 82%," says Jeff Currie. "$3.8 trillion of investment in renewables moved fossil fuels from 82% to 81% of the overall energy consumption." pic.twitter.com/VhQN0S9oo9
Economist Jeff Currie of Goldman Sachs (Global Head of Commodities Research in the Global Investment Research Division):
“Here’s a stat for you, as of January of this year. At the end of last year, overall, fossil fuels represented 81 percent of overall energy consumption. Ten years ago, they were at 82. So though, all of that investment in renewables, you’re talking about 3.8 trillion, let me repeat that $3.8 trillion of investment in renewables moved fossil fuel consumption from 82 to 81 percent, of the overall energy consumption. But you know, given the recent events and what’s happened with the loss of gas and replacing it with coal, that number is likely above 82.” … The net of it is clearly we haven’t made any progress.”
It is hard to get your head around the fact that $3.8 trillion has been spent with so little results. A lot of that money has been going to Crony Capitalists through subsidies and tax forgiveness.
That they have not made any progress replacing fossil fuels is understandable and that it is unlikely that wind and solar ever will. Their lack of dispatchability will forever prevent wind and solar from being the main source of power. Long term, nuclear power will have to be the main source of power with wind and solar playing second fiddle.
An HTMR-100 cannot melt down. If the worst possible event were to occur, the reactor will just shut itself down. If all cooling stops, the reactor will heat up a bit for 24 hours and then over the next 4 to 5 days will just cool down with no incident. That is ‘walk away safe’.
Nuclear power is the future of mankind. The world’s electricity insecurity experienced since 2020 has shown the way forward with great clarity.
Furthermore, nuclear is the only known efficient, reliable, safe, continuous and truly ‘green’ energy technology:
Fracking: note the deep shaft The people doing the banning conveniently forget they can’t enough gas at the moment, including from the US obtained by the method they profess not to like. But importing fracked gas is no problem, essential even.
– – –
The ban on fracking in England will be reinstated, new Prime Minister Rishi Sunak has said.
It reverses a decision by his predecessor Liz Truss, says BBC News.
Fracking was first halted in England in 2019, amid opposition from green groups and concerns about earth tremors.
What is fracking?
Hydraulic fracturing, or fracking, is a technique for recovering gas and oil from shale rock.
It involves drilling into the earth and directing a high-pressure mixture of water, sand and chemicals at a rock layer, to release the gas inside.
Wells can be drilled vertically or horizontally in order to release the gas.
. . .
* The ocean covers 71% of the globe and drives average temperatures;
* SSTs have a constant water content, (unlike air temperatures), so give a better reading of heat content variations;
* A major El Nino was the dominant climate feature in recent years.
Forecast:
Here’s Where a Rare “Triple Dip La Niña” Might Drop the Most Snow This Winter
— Ski Mag
The unusual weather phenomenon might result in the snowiest season in years for some parts of the country.
The best context for understanding decadal temperature changes comes from the world’s sea surface temperatures (SST), for several reasons:
The ocean covers 71% of the globe and drives average temperatures;
SSTs have a constant water content, (unlike air temperatures), so give a better reading of heat content variations;
A major El Nino was the dominant climate feature in recent years.
HadSST is generally regarded as the best of the global SST data sets, and so the temperature story here comes from that source. Previously I used HadSST3 for these reports, but Hadley Centre has made HadSST4 the priority, and v.3 will no longer be updated. HadSST4 is the same as v.3, except that the older data from ship water intake was re-estimated to be generally lower temperatures than shown in v.3. The effect is that v.4 has lower average anomalies for the baseline period 1961-1990, thereby showing higher current anomalies…
During Orwellian (energy) times, it may be prudent to look to wiser heads for clarity.
“If a private enterprise is a failure, it closes down—unless it can get a government subsidy to keep it going; if a government enterprise fails, it is expanded. I challenge you to find exceptions.”
— Milton Friedman
“When the government makes loans or subsides to business, what it does is to tax successful private business in order to support unsuccessful private business.”
— Henry Hazlitt
The great Austrian economist Ludwig von Mises was being generous by describing interventionism’s nasty side-effects as “unintended.” Some younger interventionists are naïve, and know not what they do, but the older, street-smart captains of progressive politics understand the harms their policies entail. For them, the adverse consequences are features, not bugs.
The only downside is the risk of political retribution at the polls.
That’s the predicament in which the Biden administration now finds itself. It is also the theme of “Energy Inflation Was by Design,” a new report by supply-chain consultant Joseph Toomey.
[Synopsis is in previous post Energy Inflation Playbook]
President Biden and congressional Democrats want to replace fossil fuels with a “zero-carbon” energy system. Their
“We’ve got to ride this global warming issue. Even if the theory of global warming is wrong, we will be doing the right thing in terms of economic and environmental policy.“ – TimothyWirth, President of the UN Foundation
“No matter if the science of global warming is all phony… climate change provides the greatest opportunity to bring about justice and equality in the world.” – Christine Stewart, former Canadian Minister of the Environment
Another inconvenient scientific study contesting “settled science” theology that carbon dioxide is the ‘climate control knob’.
Japanese climate scientists arguing that they have been able to show that El Niño natural weather oscillations have driven “atmospheric teleconnection” and shifted the tropical rainfall zone to the north. The higher warming up to 2012 was “accelerated” by heat from the Pacific and a phase in the North Atlantic sea current oscillation that favoured warmer conditions over Greenland and enhanced ice melt…
A popular scare story running in the media is that the Greenland ice sheet is about to slip its moorings under ferocious and unprecedented Arctic heat and arrive in the reader’s front room any day now (I exaggerate, but not much). Meanwhile back in the scientific world, scientists are scrambling to understand what natural causes lie behind the sudden slow-down in Greenland’s summer warming and ice loss dating back to 2010. The recovery of Arctic summer sea ice has been spectacular of late, with the U.S.-based National Snow and Ice Data Center reporting that this year’s September minimum was 1.28 million square kilometres higher than the 2012 low point of 3.39 million square kilometres.
Three Japanese climatologists have recently published a paper noting that “frequent occurrence of central Pacific El Niño events has played a key role in the [abrupt] slow-down of Greenland warming and possibly Arctic sea ice loss”. Of course such findings play havoc with the simplistic ‘settled’ science notion that carbon dioxide produced by humans burning fossil fuel is the main, if not only, driver of global temperature warming or cooling – a notion that leads many green activists to claim that the climate will stop changing if society signs on to a ‘Net Zero’ CO2 emissions agenda.
For instance, a bizarre ‘fact check’ on a recently published Daily Sceptic article by Facebook partner Climate Feedback claimed there had been no natural climate change for almost 200 years. It quoted Professor Timothy Osborn of the University of East Anglia, who said: “The warming from the late 1800s to the present is all due to human-caused climate change, because natural factors have changed little since then, and even would have caused a slight cooling over the last 70 years rather than the warming we have observed.”
The Japanese scientists argue that they have been able to show that El Niño natural weather oscillations have driven “atmospheric teleconnection” and shifted the tropical rainfall zone to the north. The higher warming up to 2012 was “accelerated” by heat from the Pacific and a phase in the North Atlantic sea current oscillation that favoured warmer conditions over Greenland and enhanced ice melt. Changes around Greenland can be attributed to “natural variability, rather than anthropogenic forcing”, note the scientists, “although most climate models were unable to reasonably simulate the unforced natural variability over Greenland”.
What the scientists are talking about of course are the huge heat exchanges that regularly change the climate of the Earth. As the Daily Scepticrecently reported, Professor Richard Lindzen of MIT noted that the Earth had many climate regimes, and there have been “profound” changes in temperature between the tropics and the polar regions over millennia. Meteorologist William Kininmonth recently argued that the heat exchanges were little understood, but they are one of the great drivers of climate changes. It might be suggested that these gaps in climate knowledge have allowed a view to take hold, now enforced by rigid Net Zero political control, that CO2 is the only driver of climate change.
The Daily Scepticrecently reported on a series of media scare stories about the Greenland ice sheet that followed publication of a paper in Nature Climate Change. Cherry-picking the one-off record melt year of 2012, and assuming it will be a regular occurrence, delivered a “staggering” 78cm of sea level rise between now and 2100. According to the U.S. meteorologist Anthony Watts, the claims were “false and easily disproved”. In his view they were “just modelled hokum”.
Ice amounts around the Arctic have always been highly cyclical, with periods of substantial melt and freezing common across just a few decades. As we have seen, evidence is starting to build that a recent Arctic low point is in a period of recovery, with a significant trend towards higher surface sea ice becoming apparent from the recent data.
To preserve the fiction that humans are responsible for all recent changes in the climate, it is often argued that the current temperature is the highest for 12,000 years, since the last major ice age started to lift. This is political nonsense-on-stilts, not least because geologists have a phrase for the period when temperatures were much higher than today – the Holocene Thermal Maximum. The latest science paper to show significant higher temperatures comes from a group of geoscientists led by Dr. Katrine Elnegaard Hansen of Aarhus University. According to a précis published by the No Tricks Zone climate site, the Arctic and northern Greenland were 2-4°C warmer than now between 11,700 to 4,500 years ago. Carbon dioxide levels were in the mid 200 parts per million (ppm), compared to today’s 419 ppm, ice-free open waters prevailed, and Greenland warmed 10°C in just 60 years.
Numerous other scientists have discovered equally dramatic temperature changes in the recent past. The graph below was presented by a German broadcaster in 2013 and was compiled from a number of science sources. It shows the overall long-term trend, ending in the current small rebound from the so-called little ice age,
But cyclical changes have also occurred over very short periods. A number of scientists have pointed to an abrupt global multiple degree cooling and warming period that occurred about 8,200 years ago over 150 years. Dr. Takuro Kobashi examined the paleoclimatic records from this time and found a drop of 3°C within two decades, followed by a similar rise over 70 years. Dr. Seren Griffiths of Manchester Met University reported that the event was first identified in Greenland ice cores, but subsequently noted in multiple proxies across Europe. Another abrupt cooling period is said to have occurred about 4,000 years ago.
It is legitimate to conclude from all this under-reported science that it is becoming increasingly difficult to ask us to believe that CO2, and more specifically human-caused CO2, is the only or main climate control thermostat. The evidence suggests that the gas played no such starring role in the previous 11,000 years and more of the paleoclimatic record.
Chris Morrison isthe Daily Sceptic’s Environment Editor.
“In conclusion on the basis of observational data, the climate crisis that, according to many sources, we are experiencing today, is not evident yet” (Alimonti et al., 2022).
Alimonti, G., Mariani, L., Prodi, F., & Ricci, R. A. (2022). A critical assessment of extreme events trends in times of global warming. The European Physical Journal Plus 137(1), 1-20. https://doi.org/10.1140/epjp/s13360-021-02243-9
Frightening study out of the International Journal of Vaccine Theory, Practice, and Research August 2022 documenting abnormal changes to blood cells following mRNA (Pfizer/BioNTech or Moderna) ‘vaccination’.
The Italian, peer-reviewed study found a staggering 94 percent of vaccinated patients with subsequent abnormal blood issues.
Figure 1. These photos are at 40x magnification. At the left side, (a) shows the blood condition of the patient before the inoculation. The right side image, (b) shows the same person’s blood one month after the first dose of Pfizer mRNA “vaccine”. Particles can be seen among the red blood cells which are strongly conglobated around the exogenous particles; the agglomeration is believed to reflect a reduction in zeta potential adversely affecting the normal colloidal distribution of erythrocytes as seen at the left. The red blood cells at the right (b) are no longer spherical and are clumping as in coagulation and clotting.
“Contrary to the claims of proponents of the Green New Deal and Net Zero, fossil fuels are the greenest fuels.
First, uniquely among energy sources, fossil fuel use emits CO2, which is the ultimate source of the elemental building block, carbon, found in all carbon-based life, i.e., almost all life on Earth.”
These two sentences, which run counter to everything you may have heard about the “climate crisis” said to be plaguing the planet, introduce a provocative new study by Indur Goklany, Ph. D. A widely published author and longtime researcher into a variety of scientific fields, Goklany strips carbon dioxide of its status as an environmental villain as decreed by modern-day climate orthodoxy. He also shows that rising atmospheric levels of CO2, including those produced by fossil fuels, are highly beneficial to biodiversity.
Goklany’s study, “Fossil Fuels are the Greenest Energy Sources,” was…
Southern Ocean surrounds Antarctica [image credit: theozonehole.com] Another hole in ‘settled’ climate science? Over-sensitivity to changing conditions may sound familiar. Researchers find “The major implication is that, even though the latest CMIP models improve the simulation of their mean states, such as radiation fluxes at the top of the atmosphere, the detailed cloud processes are still of large uncertainty.” Southern Ocean clouds seem to have been ‘improperly simulated’ when compared to data.
– – –
Clouds can cool or warm the planet’s surface, a radiative effect that contributes significantly to the global energy budget and can be altered by human activities, claims Eurekalert.
The world’s southernmost ocean, aptly named the Southern Ocean and far from human pollution but subject to abundant marine gases and aerosols, is about 80% covered by clouds.
How does this body of water and relationship with clouds contribute to the world’s changing climate?
The annual competition between ice and water in the Arctic ocean has reached the maximum for water, which typically occurs mid September. After that, diminishing energy from the slowly setting sun allows oceanic cooling causing ice to regenerate. Those interested in the dynamics of Arctic sea ice can read numerous posts here. This post provides a look at mid September from 2007 to yesterday as a context for understanding this year’s annual minimum.
The image above shows Arctic ice extents on day 260 (lowest annual daily extent on average) from 2007 to 2022 yesterday. Obviously, the regions vary as locations for ice, discussed in more detail later on. The animation shows the ice deficits in years 2007, 2012, 2016 and 2020, as well as surplus years like 2010, 2014 and the last two years, 2021-2022.
Note that for climate purposes the annual minimum is measured by the September monthly average…
“In the four years I have been keeping these daily data records for wind generation, the power generated from all wind plants in Australia has never been lower than it was on this day. That total generated power of 15.74GWH gave wind an average for the day of 656MW, and that was at a daily operational Capacity Factor of just 6.66%, an absolutely pitiful result from 76 wind plants with a total Nameplate of 9854MW, and around 4500 individual wind turbines…”
This Post details the daily wind power generation data for the AEMO coverage area in Australia. For the background information, refer to the Introductory Post at this link.
Each image is shown here at a smaller size to fit on the page alongside the data for that day. If you click on each image, it will open on a new page and at a larger size so you can better see the detail.
Note also that on some days, there will be a scale change for the main wind power image, and that even though images may look similar in shape for the power generation black line on the graph when compared to other days, that scale (the total power shown on the left hand vertical axis) has been changed to show the graph at a larger size to better fit the image for that…
My title concerning mRNA vaccines is a play on the Animal Farm slogan. It’s prompted by research reports looking for answers why highly vaccinated populations like those in Europe and North America experience continuing Omicron infections, while other places like Africa do not. The surprising finding is summarized at the end of the report. While two vax shots do not prevent future infections, they do protect against serious illness from the virus, and thus benefit the persons. But the data suggest that additional booster shots are counter-productive by diminishing the immune system response to further viral exposure.
A long-term study of healthcare workers in the United Kingdom has allowed their history of infection and vaccination to be traced precisely. Reynolds et al. found some unexpected immune-damping effects caused by infection with a heterologous variant…
Why is the great news that the Barrier Reef is in top condition, with record coral cover, being ignored by the MainstreamMedia™️?
With the daily and constant lecturing and hectoring about the supposed “climate catastrophe/crisis/emergency”, shouldn’t they be ringing the bells and dancing in the street?
The fact that they are not, and remain largely silent about Reef health, stands as more conclusive proof that ClimateChange™️ has absolutely nothing to do with the environment or “saving the planet” rather a wicked tool to justify complete power and control over every aspect of your life and lifestyle. Aka, global-communism.
Great Barrier Reef, Australia [image credit: BBC] Dr. Peter Ridd writes: ‘The three or four bleaching events since 2016, which have been widely reported in the media, could not have killed much coral, otherwise the 2022 statistics would not be so good.’
Time to dial down the tedious climate alarmism on this.
– – –
Official data released today reveals that Australia’s Great Barrier Reef is in excellent health, with coral cover reaching record levels for the second consecutive year, says Climate Change Dispatch.
The increase will be surprising to members of the public, who are regularly hit with scary stories about coral bleaching and false tales about a reef in long-term decline.
A new note, published today by the Global Warming Policy Foundation, explains that the data shows clearly how a handful of coral bleaching events that have affected the reef since 2016 have had a very limited…
Example of product type used by the wind industry So much for ‘keeping it in the ground’, as climate obsessives like to intone to anyone who will listen to their anti-oil rants.
– – –
On Sunday, puzzled Swedish journalist and political commentator Peter Imanuelsen tweeted the news: “A wind power turbine just collapsed in Sweden”, says CNS News.
“People are being warned to keep their distance because…it is now leaking oil everywhere! “Wait, these “green” wind turbines use oil???”
The Financial Post of July 09, 2022, reported that Canada will release a sanctioned, overhauled gas turbine to Germany, for use in Russia’s Nord Stream 1 gas pipeline, hopefully preventing a further collapse of Germany’s economy, says Friends of Science. Critics denounced the move as conflicting with Canada’s “Stand with Ukraine” policy. According to Canada’s international trade website: “Germany, with the largest economy in the EU and the fourth largest in the world … Germany is Canada’s largest export market in the EU…with two-way merchandise trade totaling $25.8 billion in 2021.”
Germany is heavily reliant on natural gas from Russia. DW reported on July 11, 2022, that Germany was preparing for possible total Russian gas cut-off which would mean economic collapse and social strife due to rationing of low gas reserves and a cold winter ahead.
EChemi reported in April 2022, Germany chemical giant…
We have a crisis in India, and it is not with the climate. Power plants for the world’s second largest consumer of coal are running out of stock, leaving a billion people at the risk of blackouts and forcing industries to close facilities.
To resolve the situation, the Indian government has authorized increased importation of thermal coal, removed all import duty on coal, is reopening hundreds of closed coal mines, and has asked existing domestic mines to produce at unprecedented rates. The country has even canceled dozens of commercial trains to make room for the freight trains that carry coal.
Coal-fired plants produce more than 70 percent of all electricity consumed by India’s 1.3 billion people. Indicating greater demand, coal-based electricity registered a 3.12 percent increase in March 2022 compared to a year ago. Coal shortages can have a devastating effect on the Indian economy.
Rather inconvenient numbers for “climate crisis” enthusiasts! However, as the MainstreamMedia™️ will never inform them of the abundance and above average levels of Arctic sea-ice for May, they will be none the wiser and continue their jolly sleepwalk into “NetZero” oblivion.
The animation shows Arctic ice extents on day 151 (end of May) from 2006 to yesterday 2022. It is evident that typically there are some regional seas starting to melt by this date, whereas 2022 remains frozen solid. More detailed analysis is below, but note the 2022 surplus is 600k km2, or 5% above the 16 year average for day 151. That extra ice extent amounts to 0.6 Wadhams, or 6826 Manhattan Islands, whichever index you prefer. The graph below shows May 2022 daily ice extents compared to the 16-year average and some other years of note.
The black line shows during May on average Arctic ice extents decline ~1.8M km2 down to 11.7M km2. The 2022 cyan MASIE line only lost 1.3M km2, starting the month 141k km2 above average and on day 151 showed a surplus of 598k km2. The Sea Ice Index in orange (SII from NOAA)…
“WHEN the heart rules the head,
passion takes over reason.”
– Ortega y Gasset
“IT would not be impossible to prove with sufficient repetition and a psychological understanding of the people concerned that a square is in fact a circle. They are mere words, and words can be molded until they clothe ideas and disguise.” ― Joseph Goebbels
***
THE widely held belief that ‘Extreme Weather’ has become worse, as a result of man-made carbon dioxide emissions, is a tribute to the success of climate change propaganda pushed relentlessly by CO2-centric politicians and compliant mainstream media.
Promoting Extreme Weather is specifically designed to shift public opinion about the purported seriousness of human-induced global warming climate change, through the use of emotional imagery and dire prognostications in order for draconian and costly climate policy to be accepted and implemented with as little resistance as possible from the taxpaying public.
COGNITIVE BIAS fuelled by an era of mass hysteria, delusion, groupthink and panic has helped foster dark and far-fetched clichés of a current “climate crisis”, that is an “existential threat” which will “end civilisation by 2030”.
*
Thanks to the dramatic rise in personal weather recording devices – smart phones and CCTV – the sampling rate (what you see or hear directly) of Extreme Weather events, broadcast via social and mainstream media, has risen dramatically in recent years.
But, have actual Extreme Weather events increased in frequency or intensity? In particular, over long-term ‘climate’ scales?
The short answer is no! Extreme Weather events have not increased in frequency or intensity as carbon dioxide emissions have increased. In many cases the exact opposite is occurring.
This ‘inconvenient’ fact has been proven by empirical data and confirmed by the last two (warmist) U.N. IPCC reports on Extreme Weather: SREX (AR5) 2013 report and the latest SR15 report released August, 2018:
UN IPCC : “Low confidence in the sign of drought trends since 1950 at global scale…likely to be trends in some regions of the world, including increases in drought in the Mediterranean and W Africa & decreases in droughts in central N America & NW Australia” – UN IPCC SR15 (2018)
IN 1934, when CO₂ was at ‘safe’ levels, severe to extreme drought covered around 80% of the entire U.S. Such conditions endured for most of the decade known as the “Dust Bowl” era :
“There is low confidence due to limited evidence, however, that anthropogenic climate change has affected the frequency and the magnitude of floods.” – UN IPCC SR15 (2018)
“Numerous studies towards and beyond AR5 have reported a decreasing trend in the global number of tropical cyclones and/or the globally accumulated cyclonic energy”– UN IPCC SR15 (2018)
“There is only low confidence regarding changes in global tropical cyclone numbers under global warming over the last four decades.” – UN IPCC SR15 (2018)
2018 was one of the least active US tornado years on record, despite record and rising CO₂ emissions.
AS of October, a new record low tornado count was set. The cumulative total for 2018 is 759; the previous lowest number of tornadoes for this date was 761. The SPC has records extending back 65 years.
This lack of tornadic storms in recent years should also correlate with lesser severe thunderstorm activity in general in the U.S., since the conditions which produce large hail and damaging winds are generally the same as are required for tornadoes (strong instability, plentiful moisture, and wind shear). – Roy Spencer PhD
NB// LOSS data does not include the two big CAT4’s that struck the US in 2018 – Florence (Sep) and Michael (Oct).
***
CONCLUSION
BIAS BY OMISSION
IN my opinion, the worst form of propaganda is ‘bias by omission’ – information and facts that you are ‘not’ told about, in order to keep the truth from you.
THE mainstream media has not and will not report the facts on “Extreme Weather”, as clearly laid out in the science and data above, because such facts are obviously extremely ‘inconvenient’ to their “catastrophic” man-made global warming narrative.
*
VITAL information central to the potential seriousness of climate change – Extreme Weather – has been purposely omitted by the mainstream media and replaced by emotions, alarmism and exaggerations in order to fit the climate-calamity narrative designed to scare you into belief and obedience.
THIS is why the global warming climate change debate has become so dangerously deceptive and dishonest. Climate truths hidden from you and replaced with a narrative far more acceptable – Hollywood-style climate hysteria based on alarmism, increased sampling rates and overheated, CO2-centric climate models that do not accord with observed reality.
•••
UPDATE
DID not see either of these instructive graphs painted on a placards at any of the kiddie climate rallies last Friday. Guess they don’t fit their ‘catastrophic’ climate narrative…
Global Deaths from Climate and non-Climate Catastrophes, 1920-2018
Carbon Emissions and World Prosperity
*
PERHAPS the climate kids would have been wise to read and learn the words of H.L. Mencken, before being forced out by their parents and teachers to act as standard bearers of new radical eco-socialism, protected by ‘innocence’ and lack of age :
“The whole aim of practical politics is to keep the populace alarmed (and hence clamorous to be led to safety) by menacing it with an endless series of hobgoblins, all of them imaginary. The urge to save humanity is almost always a false front for the urge to rule it.” – H.L. Mencken
“As you know, I’m not political. If anything, I would like to see the climate change happen, so the science could be proved right, regardless of the consequences. This isn’t being political, it is being selfish.” – Phil Jones (Uni East Anglia CRU Head)
“The data doesn’t matter. We’re not basing our recommendations
on the data. We’re basing them on the climate models.”
– Prof. Chris Folland,
Hadley Centre for Climate Prediction and Research
THE “Hottest Year Ever” meme is just one in a long line of propaganda tools used by the Climate Crisis Industry to make you believe that the 1°C rise in global temperature since the end of the Little Ice Age – around 1880 – is “unprecedented” and will bring chaos to wildlife, humans and the planet.
HOW much of these claims are scientific, versus propaganda designed to heighten alarm around the agenda of catastrophic anthropogenic global warming (CAGW), is the centre of much conjecture and debate.
OF particular concern is how a handful of government climate ‘scientists’ have ‘homogenised’ the official surface-based temperature records to land us in the costly, hot mess we face today.
*
SATELLITES Vs THERMOMETERS?
*
ATMOSPHERIC SATELLITES
NASA’s 15 MSU and AMSU satellites generate the RSS and UAH datasets, which measure the average temperature of every cubic inch of the lower troposphere, the exact place where global warming climate change theory is meant to occur.
MEARS’ objectivity towards the business of global temperature data collection and reporting can be found in his commentary on his website, whilst making his global-warmist intentions clear by unleashing the groupthink pejorative “denialist” – in distasteful reference to NAZI holocaust denial…
MEARS then published a paper claiming that new and improved ‘adjustments’ had “found” that missing warming.
Mears, C., and F. Wentz, 2016: Sensitivity of satellite-derived tropospheric temperature trends to the diurnal cycle adjustment. J. Climate. doi:10.1175/JCLID- 15-0744.1, in press.
FOR the purpose of this post, we’ll look at the untampered UAH (University Alabama Huntsville) satellite data set run byDr. John R. Christy – Distinguished Professor of Atmospheric Science and Director of the Earth System Science Center at The University of Alabama in Huntsville, and Roy Spencer Ph.D. – Principal Research Scientist at UAH.
SPENCER comments on the divergence between RSS and UAH post “adjustment”:
“We have a paper in peer review with extensive satellite dataset comparisons to many balloon datasets and reanalyses. These show that RSS diverges from these and from UAH, showing more warming than the other datasets between 1990 and 2002 – a key period with two older MSU sensors both of which showed signs of spurious warming not yet addressed by RSS. I suspect the next chapter in this saga is that the remaining radiosonde datasets that still do not show substantial warming will be the next to be “adjusted” upward.
The bottom line is that we still trust our methodology. But no satellite dataset is perfect, there are uncertainties in all of the adjustments, as well as legitimate differences of opinion regarding how they should be handled.
Also, as mentioned at the outset, both RSS and UAH lower tropospheric trends are considerably below the average trends from the climate models.
GLOBAL atmospheric temperatures continue their rapid decline off the record heights of the 2015/16 super El Niño, despite record and rising CO2 emissions.
UAH global average lower tropospheric temperature (LT) anomaly for December, 2018 was +0.25°C above the 40-year average:
Our planet has just experienced the most extreme two-year cooling event in a century. But where have you seen this reported anywhere in the mainstream media?
You haven’t, even though the figures are pretty spectacular. As Aaron Brown reports hereat Real Clear Markets:
From February 2016 to February 2018 (the latest month available) global average temperatures dropped 0.56°C. You have to go back to 1982-84 for the next biggest two-year drop, 0.47°C—also during the global warming era. All the data in this essay come from GISTEMP Team, 2018: GISS Surface Temperature Analysis (GISTEMP). NASA Goddard Institute for Space Studies (dataset accessed 2018-04-11 at https://data.giss.nasa.gov/gistemp/). This is the standard source used in most journalistic reporting of global average temperatures.
The 2016-18 Big Chill was composed of two Little Chills, the biggest five month drop ever (February to June 2016) and the fourth biggest (February to June 2017). A similar event from February to June 2018 would bring global average temperatures below the 1980s average. February 2018 was colder than February 1998.
To put this temperature drop in context, consider that this is enough to offset by more than half the entirety of the global warming the planet has experienced since the end of the 19th century.
BY their own admission, the ocean data is also fake.
date: Wed Apr 15 14:29:03 2009
from: Phil Jones <p.jones@uea.ac.uk> subject: Re: Fwd: Re: contribution to RealClimate.org
to: Thomas Crowley <thomas.crowley@ed.ac.uk>
Tom,
The issue Ray alludes to is that in addition to the issue
of many more drifters providing measurements over the last
5-10 years, the measurements are coming in from places where
we didn’t have much ship data in the past. For much of the SH between 40 and 60S the normals are mostly made up as there is very little ship data there.
NOW it’s time to see how NASA GISS (Gavin Schmidt) and NOAA (Tom Karl) have created the ‘hockey-stick’ temperature rise over recent years in order to drive the Mann-made global warming agenda.
MIND-blowing adjustments to raw data that without exception – cool the past and warm the present – despite UHI (Urban Heat Island effect) undoubtedly compromising the latter parts of the modern temp record.
AND, if you think that the tampering of the earth’s temperature record, by cooling the past and warming the present to fit the man-made global warming narrative is another climate “denier” conspiracy theory then read this Climategate email from the UK’s leading climate expert, Phil Jones, to the UK Met Office and officials:
GLOBAL WARMING Is The Greatest And Most Successful Pseudoscientific Fraud In History | Climatism
THE problem of the 1940’s warming “blip” :
THEY did exactly what Wigley was suggesting, removing more than 0.15 C from 1940′s global temperatures. This tampering is what made the hockey stick possible.
If the present refuses to get warmer, then the past must become cooler …
NASA make up record temperatures in countries where they have no thermometer data. NOAA’s current data in Africa and much of the rest of the world is fake.
THIS enables them to make the fake “Hottest Year Ever” announcements. Memes that have more to do with PR and marketing than actual science:
THE NASA global temperature record has been massively altered over the last 20 years to cool the past and warm the present:
Steve Goddard on Twitter: “The @NASA global temperature record has been massively altered over the last 20 years to cool the past and warm the present.…”
*
NASA GISS : THE DATA SET OF CHOICE FOR THE CLIMATE THEORY OBSESSED MAINSTREAM MEDIA & POLITICAL ELITE!
IT’s not difficult to see why the NASA GISS data set is the preferred go-to for global warming activists, mainstream media, the UN IPCC and virtue-peddling politicians seeking to destroy cheap, efficient energy supply – namely coal-fired power – through the implementation of draconian climate change policy, and proposals like the U.S. Democrats’ “New Green Deal”, that if implemented will annihilate both the U.S. and the global economy and result in total control of every aspect of your life, lifestyle and any freedoms you currently enjoy.
NASA GISS’ Gavin Schmidt wants to use his junk science to control public policy, and says questions from policy makers are “tiresome” :
PRESIDENT EISENHOWER WARNED US OF THE “danger that public policy could itself become the captive of a scientific-technological elite.”
“The prospect of domination of the nation’s scholars by Federal employment, project allocations, and the power of money is ever present — and is gravely to be regarded.
Yet, in holding scientific research and discovery in respect, as we should, we must also be alert to the equal and opposite danger that public policy could itself become the captive of a scientific-technological elite.”
President Eisenhower January 17, 1961
*
CONCLUSION
FOR so long, climate ‘sceptics’ have been labeled climate/science “deniers”, in crude reference to those who deny the holocaust, with the pejorative used in a broader effort to shut down debate and silence dissent. However, when hard evidence is laid out over alarmist rhetoric, it’s not hard to see who in fact are the real deniers of history and indeed, deniers of science.
EVEN when hard data, “the science” and empirical evidence completely contradict alarmist predictions and forecasts peddled by the mainstream media and grant-driven ‘scientists’, alarmists continue to double-down on their fear-mongering instead of evaluating their theory, adhering to the “scientific method” and admitting that they might just have got it all wrong.
*
GLOBAL WARMING dogma has ruinously snowballed into a $TRILLION dollar religion to be defended at all costs by alarmist ‘scientists’, UNreliables rent-seekers and the climate theory-obsessed mainstream media in order to protect egos, jobs, reputations and access to unlimited “Save The Planet” taxpayer trillions, completely immune to oversight.
TIME to stop the rot for the sake of “science” and Western civilisation that has given us so much to be thankful for, like the dramatic drop in global poverty. Primarily due to the deployment of cheap, reliable and abundant hydrocarbon fuels. Life-giving and poverty-reducing energy sources that the zero-emissions zealots want to replace with sunshine and breezes, forcing us backwards down the energy ladder to the days of human, animal and solar power.
JUST as socialist central planning failed miserably before it was replaced by free market economies, green central planning will have to be discarded before Australia and other Western nations, crippled by the mad rush into costly and ruinous UNreliables, will see a return to energy security, competitive pricing and a ‘liveable’ existence for our most vulnerable.
LIKEWISE, climate data fraud must be called out and crushed with the scientific method restored to allay dangerous and costly climate change fear and alarmism.
CLIMATE change alarmists conveniently ‘deny’ the existence of the 1970’s “global cooling” scare because such panic, a mere 40 years ago, threatens the legitimacy of the current “global warming” scare.
However, climate experts and government agencies of the day were indeed warning of impending climate doom and that we must take immediate “action” to avoid catastrophe.
Sound familiar?
Warming alarmists rebut the 1970’s global cooling scare with claims that the phenomenon wasn’t “peer-reviewed” or that a “consensus” of “97%” of “scientists” didn’t agree. However, it doesn’t take Einstein to realise that the fashionable eco-scare of the day was indeed very real…
*
IN 1976 the CIA warned the cooling climate would bring – “drought, starvation, social unrest and political upheaval” :
MAJOR world climate changes were under way that would cause economic and political upheavals “almost beyond comprehension”, an internal report of the Central Intelligence Agency has warned the US Government.
“The new climatic era brings a promise of famine and starvation to many areas of the world”, the report warns.
The report, which contends that the Climate changes began in 1960, is based on a study by Mr Reid Bryson of the University of Wisconsin.
Its basic premise is that the world’s climate is cooling and will revert to conditions prevalent between 1600 and 1850 — when the earth’s population was less than 1,000 million and its rural, pre-industrial era civilisations were largely capable of feeding themselves.
The report, which- was concerned with possible political and economic threats the United States could expect from such drastic events, said the starvation and famine would lead to social unrest and global migration of populations.
On this day September 8, 1900, Galveston—a low-elevation sand island just off Texas’s Gulf coast—was struck by a category 4 hurricane that decimated the island and killed thousands of people, making it the deadliest natural disaster in U.S. history.
This slideshow requires JavaScript.
117 years later, today, one of the biggest Hurricanes ever recorded in Atlantic history is busy ravaging the Caribbean, on its way to mainland USA…
Thoughts and prayers to those already affected by Irma and stay safe, those within its destructive path.
*
But, to the opportunistic climate ambulance chasers who don’t hesitate to attribute weather events like “Harvey” and “Irma” to ‘evil’ mankind – a brief hurricane history lesson to help ease the self-loathing…
Consider the following pre-industrial hurricaneevents that occurred when the climate was “perfect” and CO2 was at “safe” levels:
To give you an idea of the strength and devastation associated with these storms, below is a listing of some of the most memorable hurricanes since pre-colonial times. While the number of casualties from these storms have gone down over the years, the cost from the damage caused by these storms have risen tremendously. That has resulted from more building along the coastline, and more expensive homes and businesses.
Hurricane of July, 1502–Was a storm that the great explorer and discoverer of American, Christopher Columbus, predicted would strike the island of Hispanola. He used his prediction to warn the Governor of Hispanola, Nicholas de Ovando, who had 30 ships in his fleet set sail back to Spain. However, the governor ignored him, and refused Columbus’ request to stay in port at Santo Domingo. Within two days the storm struck in the Mona Passage between Hispanola and Puerto Rico, and sank 21 of the 30 ships, and killed approximately 500 sailors.
Tempest of 1609–At the time that the first ever colony in the United States was being developed, a strong hurricane menaced the Western Atlantic in the weeks following the departure of a fleet with 500 colonists left Great Britain for the New World. The ships then met with the maelstrom head on, and scattering all the vessels. Most were able to survive the onslaught of Mother Nature except for the flagship of the fleet, the Sea Venture, which was deposited in the infamous “Isle of Devils.” Nevertheless, those who were on the ship still managed to reach shore, and received a much better fate than those, who had already situated themselves in the colony. The story of the Sea Venture was the basis of William Shakespeare’s play, The Tempest.
Colonial Hurricane of 1635–Was a powerful New England hurricane that struck the Massachussetts Bay Colony in 1635 some fifteen years after the Mayflower struck land at Plymouth Rock. This storm had reminded many of the pilgrims and settlers of past hurricanes that struck in the West Indies or Caribbean. Many of the pilgrims believed that this storm was apocalyptic.
1667–The Year Of The Hurricane–At a time when the Mid-Atlantic states of North Carolina, Virginia, and Maryland agreed to temporarily halt production of tobacco, a strong hurricane ripped through the Mid-Atlantic region on August 27th. While there was no recorded statistics such as where the storm made landfall, its track, and its forward speed and intensity. It destroyed 80 percent of the tobacco and corn while destroying some 15,000 homes in Virginia and Maryland.
Accomack Storm of October 1693–This storm was captured by Mr. Scarburgh at his residence in Virginia’s Eastern Shore. Described by many weather record keepers as a very powerful storm, the Accomack Storm “cut inlets as far north as Fire Island, near New York City.”
The Great Gust of 1724–According to Rick Schwartz’s book, “Hurricanes and the Mid-Atlantic States,” two hurricanes brought significant wind and rain to the Mid-Atlantic region in 1724. The first storm moved through the area around August 12th, and caused torrential rains and devastating winds. Less than a week later, another violent storm system came through on August 17th, 18th, and 19th with violent winds and rain. These two systems are among the most significant tropical storms to affect the Mid-Atlantic during the colonial period of the late 1600s and 1700s.
Hurricane of October, 1743–A storm that affected what would become the Northeastern United States and New England, brought gusty winds and rainy conditions as far as Philadelphia, and produced flooding in Boston. Central barometric pressure of the storm was measured to be 29.35 inches of Hg in Boston. This storm, which wasn’t particularly powerful, was memorable because it garnered the interest of future patriot and one of the founders of the United States, Benjamin Franklin, who believed the storm was coming in from Boston. However, it was going to Boston. Nevertheless, it began the long educational journey, which would be our understanding of hurricanes.
Hurricane of October, 1749–The storm was perhaps one of the strongest storm ever in the Mid-Atlantic. According to Rick Schwartz, the hurricane produced a huge tidal surge of 15 feet. Based upon that observation, many experts believe that this system was a Category Four on the Saffir-Simpson Scale. It was responsible for creating Willoughby Spit, a small area of land near Norfolk that was inside the Chesapeake Bay.
The Great Chesapeake Bay Hurricane of 1769–This hurricane plagued the Mid-Atlantic coast from North Carolina up into the Chesapeake over the two days of September 7-8, 1769, and was probably one of the strongest storms in the Mid-Atlantic during the 18th Century. It made landfall near New Bern, North Carolina, and laid that town in ruin as tides rose 12 feet above normal. Most notably, it caused widespread damage to the Stratford Hall plantation, which belonged to the family of famous confederate General Robert E. Lee.
The Independence Hurricane of 1775–With the winds of revolution blowing about in the fledgling 13 colonies, Mother Nature had a wind that temporarily put a halt to those rebellious thoughts. A hurricane roared up the East Coast, and triggered one of the early Revolutionary War skirmishes in the biggest colony of Virginia. It came close to impacting Georgia and South Carolina on September 2nd before moving ashore over North Carolina. The storm then picked up steam through Virginia, Maryland, and Pennsylvania. One of the more notable casualties of the storm was the roof of the Maryland State House, which was replaced by a wind resistant dome.
Great Hurricane of 1780–This storm was one of several that year, which was one of the worst hurricane seasons in the era prior to record taking. Winds were estimated to be Category Four strength at 135 mph. This storm, which affected the Southern Windward Islands including Barbados, St. Vincent, Grenada, Martinique, St. Eustatius, and near Puerto Rico and Grand Turk Island, is believed to have killed approximately 22,000 people. Of that total, between 4,000 and 5,000 people were killed on St. Eustatius. Martinique had an estimated 9,000 people killed including 1,000 in St. Pierre, which had all of its homes destroyed.
The Great Coastal Hurricane of 1785–Hurricanes that occur within weeks of each other usually take parallel tracks. Take a look at hurricanes Katrina and Rita from 2005 for instance. The Atlantic Hurricane season of 1785 was a very busy one. One hurricane in early September of that year wrecked the ship called the Faithful Steward. Weeks later, another storm developed, and brushed the Delmarva Peninsula. The storm’s legacy was the creation of the “long-sought” lighthouse at Cape Henry, which was opened seven years later in 1792. Lighthouses were essential in preventing shipwrecks like the Faithful Steward, and another immigrant ship guided by shipmaster, Captain Smith.
George Washington’s Hurricane of 1788–This hurricane, which began its drive toward landfall after nearing Bermuda on July 19th, proceeded on a west-northwest course into the Outer Banks of North Carolina, and then into Virginia. The Chesapeake Bay region absorbed the worst that the storm had to offer. Most notably though, this storm is remembered for the way it was described by the father of the United States, and first president, George Washington. By the time the storm reached Washington’s home in Mount Vernon, it was likely to have been a moderate tropical storm with winds about 50 mph.
Hurricanes of 1795–Two hurricanes assaulted Virginia in August 1795, and destroyed the crops of another hero of the American Revolution, Thomas Jefferson. The two storms, which were ten days apart, caused the Appomattox River to crest more than 12 feet above flood stage at the city of Petersburg, which was the highest level reached in 70 years. Jefferson, who kept a perfect record of regular weather observations for 40 years between 1776 and 1816, recorded the devastation that the two storms left behind, especially the heavy losses that he suffered at his plantation, the famous Monticello.
Great Coastal Hurricane of 1806–The first major hurricane of the 19th Century made landfall south of the city of Wilmington on the southern shores of North Carolina on August 21st, and then proceeded on a gradual northeasterly drift for about 250 miles over the subsequent 36 hours. Constant gale force winds produced tremendous beach erosion, and “firmly established” the sandbar of Willoughby Spit at the mouth of the Chesapeake Bay near Norfolk. It was also responsible for the loss of the ship, Rose-in-Bloom, which founded near Barnegat, New Jersey.
Great September Gale of 1815–Was the last hurricane to strike New England before the Long Island Express of 1938. The storm struck on September 23, 1815, and brought an 11 foot storm surge to Providence, which was the highest storm surge in the Rhode Island captial prior to the Great Hurricane of 1938, which had a 17.6 foot storm surge. This storm was the first hurricane to strike New England in exactly 180 years.
Cape May Hurricane of 1821–The last major hurricane to make a direct landfall in the Garden State of New Jersey. This storm, which was a Category Four Hurricane, struck Cape May, New Jersey on September 3, 1821, and had hurricane force winds go as far west as Philadelphia while folks in New Jersey experienced wind gusts of up to 200 mph. The storm cut a path of destruction that is similar to that of the Garden State Parkway. More detailed information on this hurricane is at Greg Hoffman’s Real Lousy Weather Page.
The Hurricane of 1846–Referred to as “The Great”, used its northeast quadrant that caused havoc on the Delaware all the way up to Camden, New Jersey. This storm revealed the fact that Delaware Bay is open to southeast winds in the right quadrant, and water in the Bay would go upriver into cities such as Wilmington, Philadelphia, and Camden.
The Last Island Hurricane of 1856–A monster hurricane struck the resort Louisiana island. The storm represented the beginning of the decline of the island for high society people in Louisiana. It only killed 284 people, but among those dead were prominent Louisiana officials of the time including the lieutenant governor, the speaker of the State house of representatives, and many others prominent in the political and social history of the State.
Hurricane of September, 1874–Struck the Carolinas around the end of September, 1874. This storm is remembered for being the first such hurricane to be shown on a weather map by the Weather Bureau. At the time it was shown, the hurricane was located off the Southeast Coast between Jacksonville, Florida and Savannah, Georgia.
Hurricane of September, 1875–Was an intense hurricane that struck the Southern Coast of Cuba as predicted by Father Benito Vines, who began to develop a tremendous reputation for accurately predicting when and where a hurricane would strike. His studies of tropical storms and hurricanes during the latter portion of the 19th Century made the Cuban forecasters some of the best hurricane forecasters in the world at the time.
The Centennial Gale–Striking during the year of the 100th anniversary of the Declaration of Independence, the Centennial Gale was a hurricane that stormed ashore in Swan Quarter on September 16th and 17th after killing hundreds of people in Puerto Rico. Also known to many as the San Felipe Hurricane.
The Great Tempest of 1879–One of the strongest east coast hurricanes of the 19th century, the storm slammed ahsore in Eastern North Carolina on August 18th. It produced wind gusts of 138 miles per hour at Cape Lookout with gusts up to 168 miles per hour. Wind instruments from Cape Lookout to Cape Hatteras to Cape Henry in Virginia are devastated.
Indianola Hurricane of 1886–Destroyed what had been the leading port city in Texas at the time on August 19-20, 1886. Indianola, which was located in Matagorda Bay, was hit by this storm, and another one a bit more than a month later. As a result, business that previously came into that port, moved up the coast to Galveston, which became the prominent port city in the Lone Star State until it was devastated by the Great Hurricane of 1900.
The Sabine Pass Storm of 1886–A storm devastated the Johnson’s Bayou settlement, and the Sabine Pass region near the Texas and Louisiana border killing about 150 people in Johnson’s Bayou and wiping Sabine Pass off the map.
Atlantic Hurricane of 1893–Was a strong Category One Hurricane that struck New York City with 90 mph winds on August 24th of that year. Barometric pressure was only 29.23 inches of Hg, but it leved some one hundred trees in Central Park. The beach and piers on Coney Island was devastated. However, it wasn’t as bad as Hog Island, a sand spit off Rockaway Beach that was wiped off the map.
Sea Islands Hurricane of 1893–A major hurricane of Category Three strength that made landfall in Savannah, Georgia on August 27th, but its northeast quadrant hammered Sea Islands in Beaufort County, South Carolina. As a result, approximately 2,000 to 2,500 people were killed and upwards of 30,000 people were left homeless.
Cheniere Caminada Hurricane of October 1893 –A devastating hurricane swept in from the Gulf and across this barrier island in Louisiana on October 2nd, and killed approximately 1,150 people in the fishing village of Caminadville. A total of nearly 1,700 people were lost in the storm altogether.
Galveston Hurricane of 1900–The deadliest natural disaster in United States History, this Category Four Hurricane moved through Cuba into the Gulf of Mexico before slamming ashore in Galveston, Texas on September 8, 1900 killing 6,000 people.
The “Hurricane” of 1903–The storm was indicated to be a hurricane by many in the media at the time, but it was in fact, a tropical storm with 70 mph winds along the coast. It was the first such tropical storm or hurricane to impact the Jersey shore in one hundred years. It was also called the “Vagabond Hurricane” since it caused such a stir in media outlets such as Philadelphia and New York, which had people covering the storm for the various newspapers in those cities.
Miami Hurricane of 1926–This storm hit at the worst possible time for the fledgling city. Incoporated in 1896 following the extension of the Florida East Coast Railway by Henry Flagler, the city of Miami was at the end of its first boom period early in 1926. The storm also served as a lesson for those wishing to go outside during the eye’s passage. Forming a few hundred miles to the East of the Lesser Antilles on September 12th, the storm passed to the north of Puerto Rico on September 15th. Accompanied by a late issued hurricane warning, the storm arrived in Miami on the morning of September 18th. Winds peaked at 128 mph, and the pressure in Miami fell to 27.61 inches of Hg, or 935 millibars. The storm surge ranged from eight to fifteen feet, and caused $150 million dollars in damage then, or $1.7 billion today. If a similar storm hit the Miami area today, it would cause an astronomical $87 billion in damage.
Lake Okeechobee Hurricane of 1928–Carved a path of destruction throughout the Atlantic, and over the north shore of Lake Okeechobee during the period from September 6th to September 20th, 1928. This particular hurricane, which had a central pressure of 27.43 inches, was fifth all time to strike the United States in terms of intensity. It was responsible for an estimated 2,500 deaths, and some $25 million dollars in damage (equivalent to $300 million 1990 U.S. dollars). Now ranks behind Galveston as the second deadliest natural disaster in United States History.
Chesapeake Bay Hurricane of 1933–A powerful Cape Verde Storm that reached Category Four strength at one point before weakening to Category Two strength. The storm ended up striking on August 23, 1933 causing 79 million dollars in damage according to 1969 estimates, and left some 18 people dead. It also knocked out service to about 79,000 telephones as well as uprooted some 600 trees in Virginia Beach. The storm also set a record for storm surge with one that was 9.8 feet above normal in spots.
Major Hurricane of September, 1933–1933 was a very active year for tropical storms and hurricanes with 21 named storms, and 10 of them becoming hurricanes. In addition to the Great Chesapeake Hurricane of 1933, the Mid-Atlantic was hit by another hurricane almost exactly a month to the day later when a Category Three storm emerged from a disturbance in the Bahamas, and came up the coast to make landfall at Cape Lookout, North Carolina. The storm ended up causing about a fraction of the damage caused by the Chesapeake Bay storm. Only about 2,000 telephones were knocked out by the storm, and only two people died in Virginia.
Labor Day Hurricane of 1935–The most powerful hurricane to make landfall in the United States. A very small storm, this Category Five Hurricane tore through the Florida Keys with 180 mph winds, and a low pressure of 26.35 inches of Hg.
Long Island Express of 1938–A classic east coast hurricane, this Category Three storm moved rapidly from Cape Hatteras, North Carolina into New England in a matter of just six hours killing 600 people.
Great Hurricane of September, 1944–Is perhaps a forgotten storm in light of the Labor Day Hurricane of 1935, and the Long Island Express of 1938. However, this was a memorable storm in its own right. Cape Henry in Virginia was hit with sustained winds of 134 mph, and gusts up to 150 mph. Meanwhile, in Norfolk, winds reached close to hurricane force while gusts went up to 90 mph. The powerful storm caused tremendous damage along the coast from North Carolina to New England with some 41,000 buildings damaged, and a death toll of 390 people. The storm cost some $100 million dollars in damage including $25 million in New Jersey alone, where some 300 homes were destroyed on Long Beach Island. More detailed information on this hurricane is at Greg Hoffman’s Real Lousy Weather Page.
Hurricane Easy–Developing in September, 1950, Easy was perhaps one of the worst storms to hit Cedar Key since the late 1800s. This storm, which did a loop around the West Coast of Florida twice, had maximum sustained winds of 125 mph, a minimum pressure of 28.30 inches of Hg, and brought an amazing 38.7 inches of rain over two days to Yankeetown, Florida.
Hurricane King–Another powerful storm in 1950, this particular hurricane affected the Miami area in October of that year. It was a compact, but very powerful hurricane much like Hurricane Andrew. It only carved a path of destruction some 7 to 10 miles wide, but had wind gusts as high as 150 mph, minimum pressure of 28.20 inches of Hg., and a storm surge of 19.3 feet.
Hurricane Barbara–Opened up a decade of powerful storms to ravage the Carolinas in August, 1953. It struck the North Carolina coast between Morehead City and Ocracoke Island on August 13th, 1953 as a Category One Hurricane with gusts up to 90 mph, and left one dead and damages over $1 million in 1953 U.S. dollars.
Hurricane Carol–Opened up a very busy hurricane season for North Carolina in 1954 with a near miss of Cape Hatteras. Winds at Hatteras were between 90 and 100 mph, but minor damage estimated at $250,000 1953 U.S. dollars was left in the storm’s wake.
Hurricane Edna–Edna followed on the heels of Carol, and had a very similar track to Carol’s as it passed the Carolinas offshore on September 10, 1954. While the storm left minor damage and beach erosion for North Carolina, Edna ended up doing much more damage in New England after making landfall in Long Island. Damage estimates exceeded $40 million 1953 U.S. dollars, and 21 people were killed.
Hurricane Hazel–A Category Four Hurricane that came ashore in North Carolina in October, 1954, and then brought hurricane force winds as far inland as Canada. Passing 95 miles to the East of Charleston, South Carolina, Hazel made landfall very near the North Carolina and South Carolina border, and brought a record 18 foot storm surge at Calabash, North Carolina. Wind gusts of 150 mph were felt in Holden Beach, Calabash, and Little River Inlet 100 mph gusts were felt farther inland at Virginia, Maryland, Pennsylvania, Delaware, New Jersey, and New York. Hazel carved a path of destruction that left over 600 dead, and damages exceeded $350 million 1953 U.S. dollars.
Hurricane Connie–Was the first of three hurricanes to make landfall in the Carolinas in 1955. Some ten months after Hazel devastated the Tar Heel state, Connie made landfall over Cape Lookout, North Carolina on August 12, 1955. The storm produced heavy rains, tornadoes, and wind gusts up to 100 mph. The storm headed northward, and brought heavy rains in excess of 9 inches in Eastern Pennsylvania, Delaware, and New Jersey while dumping over 12 inches in portions of New York City.
Hurricane Diane–First billion dollar hurricane. Made landfall along the Outer Banks of North Carolina, and caused havoc from the Carolinas to New England in August 1955. Just five days after Connie, Diane came ashore on August 17th over Carolina Beach. At its peak, Diane produced winds of 125 mph, but at landfall winds were down 50 mph in Cape Hatteras while Wilmington had a gust of minimal hurricane force. Its flooding rains proved more devastating as they killed two hundred while establishing a new benchmark for damage. The havoc wreaked by Diane brought out Presidential Commission on Storm Modification that eventually led to Project Stormfury.
Hurricane Ione–Struck a month after Connie and Diane in September, 1955. The storm struck just west of Atlantic Beach along the North Carolina coast. This was another storm that made landfall well after it had peaked in intensity with 125 mph winds and a minimum central pressure of 27.70 inches. Nevertheless, it brought 16 inches of rainfall to parts of the Tar Heel state, and left six dead as well as $90 million in damages before curving out to sea.
Hurricane Helene–Perhaps one of the most powerful hurricanes during the 1950s not to make landfall in the Carolinas although it came very close. Helene came within 20 miles of the coast at Cape Fear on September 27, 1958. Winds still reached 135 mph at Wilmington while Southport, North Carolina had winds sustained at 125 mph with gusts between 150 and 160 mph, and a minimum central pressure of 27.75 inches.
Hurricane Donna–Had a very erratic path in the summer of 1960 that started in the Caribbean, then went to the Florida Keys, then into the Gulf of Mexico, where it would make a turn to the north and make a second landfall over Florida at Fort Myers. It continued northeastward across the Florida Peninsula, and moved back out into the Atlantic near Daytona Beach. Not done yet, Donna headed up the East Coast, and made another landfall at Topsail Island, North Carolina. It then finished its trip by heading into New England, and a final landfall across Long Island. At its peak, Donna had wind gusts ranging between 175 and 200 mph, a minimum central pressure of 27.46 inches, and a 13 foot storm surge. Its total damage cost was over one billion 1960 United States dollars while Donna left 50 people dead.
Hurricane Carla–Struck between the Port O’Connor and Port Lavaca area of Texas back in September, 1961. It was the most powerful storm to hit the Texas Coast in about 40 years. It winds were in excess of 150 mph, and gusts went up to 170 mph. Tides near Port Lavaca were 18.5 feet above normal, and the barometric pressure was 27.62 inches of Hg. Estimated damage from the storm was $408 million dollars while the death toll hit 43. Today, the cost would have been far greater.
Hurricane Hattie–Struck the then coastal capital of Belize, Belize City on Halloween in 1961. Hattie was the second or two Category Five Hurricanes from that season. Leaving some 275 people dead and some $60 million dollars in damage, Hattie devastated the Belize capital forcing government officials to move government offices and buildings inland to the city of Belmopan.
Hurricane Cleo–The first hurricane to strike the Miami area since Hurricane King in 1950, this 1964 storm produced wind gusts of 138 mph, and knee-deep water that produced some $125 million dollars in damage ($600 million 1990 U.S. dollars).
Hurricane Dora–Within a few weeks after Cleo in September, 1964, this hurricane hit the Northeastern coast of Florida at a right angle. It was the first storm ever to do this since the Great Hurricane of 1880. Dora had winds of 125 mph at St. Augustine, and produced a 12 foot storm surge.
Hurricane Betsy–A Category Three Hurricane that struck South Florida and Louisiana in September, 1965. It would be the last major hurricane to affect South Florida until Hurricane Andrew in 1992.
Hurricane Inez–Known as “The Crazy One,” Inez carved an erratic path of death and destruction from the Caribbean to Florida, and to Mexico in October, 1966. It left some 1,500 people dead, and produced millions of dollars in damage with top winds of approximately 190 mph. Minimum central pressure with Inez was recorded at 27.38 inches of Hg, which according to the Saffir-Simpson scale that came out into 1970, was equivalent to a Category Four Hurricane.
Hurricane Audrey–A rare early season major hurricane, this storm struck in Texas and Louisiana in June, 1957. It was the most powerful hurricane ever in the month of June, and it rapidly intensified over the Gulf of Mexico before making landfall leaving many caught off guard.
Hurricane Beulah–Hurricane Beulah was a Category Four Hurricane on the Saffir-Simpson scale that Texas in 1967, and produced some 150 tornadoes after making landfall. The most ever produced on record by a tropical system. Hurricane Frances in 2004 spawned half that number, which is still quite a bit in its own right.
Hurricane Camille–Was the last Category Five Hurricane to make landfall over the United States before Hurricane Andrew did in August, 1992. Hurricane Camille landfall over Gulfport, Mississippi on August 18, 1969 with winds of 180 mph, and a record storm surge of 24.3 feet. It left about 250 people dead from Louisiana to Virginia, and was responsible for approximately $1.421 billion dollars in damage.
Hurricane Celia–A powerful Category Three Hurricane that came ashore in the Corpus Christi area during the 1970 season. Sustained winds were 130 mph, which made it a strong Category Three Hurricane. Winds gusted as high as 161 mph, and ended up being the costliest storm at the time. Some other areas received wind gusts as high as 180 mph. Celia became the third major hurricane to strike the Texas Gulf Coast behind Hurricane Carla (1961) and Hurricane Beulah (1967). Today, it still ranks quite high as the National Hurricane Center places it 24th on the all time list with $453 billion dollars in damage. The silver lining in all of this was the fact that only 11 people died from the storm even though 466 people were injured, 9,000 homes were destroyed, 14,000 homes were significantly damaged, and another 41,000 suffered minor damage.
Hurricane Agnes–A minimal Category One Hurricane upon landfall in Apalachicola, Florida in June, 1972, it proceeded to cause devastating floods in Northeastern Pennsylvania as it combined with another low pressure system to dump heavy rains over the area. Damage from this storm was estimated to be about $2.1 billion dollars.
Hurricane Eloise–A powerful hurricane that formed in September, 1975, Eloise was a Category Three Hurricane with sustained winds of 125 mph, and gusts of up to 156 mph. It produced a 12 to 16 foot storm surge along the Florida Coast from Ft. Walton Beach to Panama City, Florida. With a minimum central pressure of 28.20 inches, Eloise was the first major hurricane to make a direct hit on this area in the 20th century, and caused some $1 billion dollars in damage as well as 21 deaths.
Hurricane Belle—A Category Three Hurricane at one point with 120 mph winds, Belle was the second named storm of the 1976 Atlantic Hurricane Season. The storm, which earned the nickname, “Bicentennial Belle,” would eventually weaken though to just a Category One Hurricane by the time it came ashore on Long Island. Shortly afterward, it became extratropical.
Hurricane David–A powerful Category Five Hurricane that ripped through the Caribbean with winds of over 155 mph, it struck the coast of Georgia as a Category One Hurricane on September 4, 1979. It then came up the coast, and hit the Northeast as a Tropical Storm with winds that knocked down tree branches, and even spawned some tornadoes on Long Island. Damage estimated from this storm was $320 million dollars.
Hurricane Frederick–A major hurricane that slammed into Mobile Bay in Alabama with 125 mph after struggling to maintain itself over the rugged terrain of Hispanola and Cuba. The storm caused some $2.3 billion dollars in damage to portions of the Gulf Coast.
Hurricane Allen–The first named storm of the 1980 Atlantic Hurricane Season, Allen became a Category Five hurricane on three separate occasions, and is ranked as one of the strongest storms ever recorded in the Atlantic. Allen’s eye didn’t touch land from the time it crossed the Windward Islands including St. Lucia until it came ashore near Port Mansfield, Texas.
Hurricane Alicia–A strong Category Three Hurricane with winds of 125 mph, Alicia was the last hurricane to make landfall in the Galveston, Texas area back in August, 1983. Estimated damage from this storm was $2 billion dollars.
Hurricane Elena–A very fickle storm, Elena stayed away from land in the Gulf of Mexico for about a week as upper level winds broke down above the storm. As a result, it grew from a Category One to a Category Three Hurricane with 125 mph as it came ashore in Biloxi, Mississippi in September, 1985. Estimated damage as a result of this storm was $1.25 billion dollars.
Hurricane Gloria–Termed the Storm Of The Century at one point in its life. This Category Three Hurricane made landfall over the outer banks of North Carolina, and then moved up the East Coast of the United States on September 27, 1985. Estimated damage from this storm was $900 million dollars.
Hurricane Kate–An unusually strong late season hurricane, Kate was a Category Two Hurricane that struck the Port St. Joe area of the Florida Panhandle in November, 1985. It was the latest hurricane ever recorded in a season to strike that far north in Florida. It ended up causing some $300 million dollars in damage.
Hurricane Gilbert–The most powerful storm ever recorded in the Atlantic with winds of 200 mph, and a central pressure of 26.28 inches of Hg, Gilbert came ashore in the Yucatan, and then proceeded into the Gulf of Mexico before hitting the Northern Mexican town of Matamoros with only 120 mph winds.
Hurricane Hugo–This Category Four Hurricane at landfall, carved a path from the Leeward Islands in the Caribbean to Charleston, South Carolina in September, 1989. At one point in its lifetime, Hugo reached Category Five intensity with 160 mph winds, and a minimum central pressure of 27.11 inches of Hg. Rapidly intensifying over the Gulf Stream, it came ashore in South Carolina with 135 mph winds. This storm ranks currently second all time in terms of estimated damage at $7 billion dollars.
Hurricane Bob–This Category Two Hurricane was one of the more memorable storms of 1991 besides the “perfect” Halloween Gale later that year. It moved up the East Coast before making landfall in New England. Believe it or not, as of 2000, this storm was ranked 10th all time in terms of estimated damage with $1.5 billion dollars.
Hurricane Grace–Contrary to what was said in the movie, The Perfect Storm, Grace was only a Category Two Hurricane, but it would combine with a mid-latitude cyclone to form what would be known as the “Perfect Storm” in Meteorological terms during the final days of October, 1991.
Hurricane Andrew–This is probably the most recent memorable hurricanes in modern history. After struggling to develop in the Atlantic, this Category Five Hurricane rapidly developed over the Gulf Stream, and devastated South Florida with 165 mph winds on August 24, 1992. It was the costliest natural disaster on record with some $30 billion dollars in damage.
Tropical Storm Alberto–Was a strong tropical storm at landfall in early July, 1994, but it would end up being one of the most memorable tropical storms as it proceeded to meander over Northwest Florida and Southern Georgia, and dump a tonnage of rain there. When it was all said and done, it left 31 people dead, and caused some $500 million dollars in damage.
Tropical Storm Beryl–Was practically a carbon copy of Alberto except for the fact that it occurred a month and a half later in August, 1994. Slightly weaker than Alberto was, Beryl had 60 mph winds, and a minimum central pressure of 29.50. Nevertheless, it dumped another 9 inches of rain on already waterlogged Tallahassee, and another 10.7 inches on Apalachicola.
Hurricane Gordon–One of the most erratic moving hurricanes, and still one of the most deadly in the last 20 years. Starting out in the Western Caribbean off the coast of Honduras and Nicaragua, Gordon weaved his way through the Caribbean and Florida before making its first landfall along the Outer Banks of North Carolina. It then turned southwestward again, and moved over Florida, where it finally dissipated. The storm left some $400 million dollars in damage, and 1145 people dead in November, 1994.
Hurricane Erin–Was one of a number of tropical storms and hurricanes in 1995. It actually made two landfalls over Florida. The first occurred on August 2nd at Vero Beach, and the second a few days later over Pensacola as a strong Category One Hurricane with 90 mph winds. Rain from this system was felt as far north as Illinois, and the storm caused some $700 million dollars in damage.
Hurricane Luis–One of the most powerful hurricanes of the 19 storms from the 1995 Season. Pummeled the Leeward Islands as well as parts of Puerto Rico and the Virgin Islands with 150 mph winds before turning out to sea in September, 1995. Caused approximately $2.5 billion dollars in damage and killed 17 people.
Hurricane Marilyn–Formed on the heels of Hurricane Luis in the Western Atlantic back in September, 1995, and brought Category Three Hurricane force winds to parts of the Leeward Islands and the Virgin Islands before turning out to sea. Caused approximately $1.5 billion dollars in damage, and left 8 people dead.
Hurricane Opal–This late season storm rapidly developed into a very strong Category Four Hurricane before weakening to a strong Category Three Hurricane when it came ashore near Pensacola, Florida in October, 1995. Opal ranks fifth all time in terms of damage with an estimated $3 billion dollars.
Hurricane Roxanne–Formed in the Bay of Campeche region of Mexico in the weeks following Hurricane Opal’s landfall near Panama City, Florida. The storm was a Category Three Hurricane with sustained winds of 115 mph, and a minimum central pressure of 28.23 inches of Hg. The storm left 14 people dead and some $1.5 billion dollars in damage.
Hurricane Bertha–The earliest hurricane to form in the Eastern Atlantic. Developed just West of the Cape Verde islands in the last week of June, 1996, and made landfall as a Category Two Hurricane over Wilimngton, North Carolina on July 12, 1996. Killed 12 people, and caused some $275,000,000 dollars in damage.
Hurricane Fran–The most powerful hurricane to make landfall in the United States during the 1996 Hurricane Season. Made landfall over North Carolina with 115 mph winds in September of that year, and caused some $3.2 billion dollars in damage at the time. Damage estimates are even higher today.
Hurricane Hortense–Was a hurricane that formed during the Labor Day Weekend of the 1996 Hurricane Season. While the storm didn’t make landfall in the United States, it ravaged parts of the Caribbean including Puerto Rico with torrential rains. Damage estimates from this storm is approximately $500 million dollars. After that, it grew in strength to a Category Four Hurricane.
Hurricane Georges–A Classic Cape Verde Hurricane that formed in September, 1998, Georges ripped through the Leeward Islands and Caribbean with as high as 150 mph winds. It then hit the Florida Keys before making landfall in Mississippi. Left 602 people dead, and caused about $5.9 billion dollars in damage.
Hurricane Mitch–A very powerful late season hurricane, Mitch had winds of 190 mph before making landfall in Central America. It devastated Honduras with over 75 inches of rain that spawned devastating floods and mudslides that left about 11,000 people dead in October, 1999.
Hurricane Floyd–Also termed Storm of the Century at one point, Floyd caused the largest peacetime evacuation in history that involved 3,000,000 people from South Florida to Cape Hatteras, North Carolina as it bore down on the Southeast coast in September, 1999. It later made landfall as a Category Three Hurricane over North Carolina, and would bring up to 30 inches of rain from North Carolina to New Jersey spawning terrible floods. Floyd ranks third all time in damage with an estimated $4.5 billion dollars in damage althogh some estimates run as high as $6 billion.
Hurricane Irene–Is an often forgotten storm from the 1999 Hurricane Season except for those in Florida. Forming during the middle of October that year, Irene became a Category Two Hurricane with 100 mph sustained winds, and higher gusts. The storm also produced some 10 to 20 inches of rain across South Florida while causing 8 deaths by electrocution, and $800 million dollars in damage.
Hurricane Lenny–Known by those in the Caribbean as “El Zorito”, or “the Lefty”, Lenny was the first ever storm on record to strike the Lesser Antilles from the West in November, 1999. It was also the most powerful late-season storm on record with 150 mph winds. The storm was responsible for approximately $330 million dollars in damage.
Hurricane Keith–Powerful Category Four Hurricane that struck the Central American country of Belize in the first week of October, 2000. Making landfall near the area of Belize City, the storm caused some two million dollars in damage, and left 11 people dead.
Tropical Storm Leslie–Started out as a subtropical depression in the Florida Straits, and brought some 15 to 20 inches of rain to parts of South Florida. Caused about 1,000,000 dollars in damage, and killed two people. After flooding South Florida, it gained more tropical characteristics, and became a minimal tropical storm in October, 2000.
Hurricane Michael–Formed in the Western Atlantic in the last weeks of October, 2000, and eventually headed northward into the Canadian Maritimes, where it brought 100 mph winds to parts of Newfoundland in Canada.
Tropical Storm Allison–Became the first tropical storm to get its name retired. Also was the costliest tropical storm on record as it caused some $4 to $5 billion dollars in damage. Heavy rains from the storm produced tremendous flooding in the Houston, Texas area in the first weeks of June, 2001.
Hurricane Iris–A very small and narrow hurricane that brought 145 mph winds to the central portion of Belize in October, 2001. The storm left some 28 people dead including tourists from Virginia, and caused millions of dollars in damage.
Hurricane Michelle–A powerful late season hurricane, Michelle brought 135 mph winds to portions of Western Cuba and the Isle of Youth before turning east and avoiding South Florida by going out to sea in November, 2001.
Hurricane Isidore–A powerful Category Three Hurricane that originally developed in the Caribbean, Isidore made landfall over the Yucatan Peninsula with 125 mph, but only made landfall over Louisiana as a tropical storm in September, 2002.
Hurricane Lili–Another powerful hurricane that formed in the Caribbean on the heels of Isidore, Lili grew to Category Four Strength with 140 mph winds. Threatening Louisiana as a major hurricane, Lili encountered hostile upper level conditions just before landfall, and weakened to just a Category Two Hurricane when it came ashore over Louisiana in October, 2002.
Tropical Storm Ana–Usually nothing much would be said about a minimal strength tropical storm that emerges from a subtropical depression, but Ana, which formed over Easter Weekend in 2003, was an exception since it became the first ever recorded storm to form in April.
Hurricane Fabian–A hurricane that last for about a week, and a tropical system that lasted for nearly two weeks, Fabian was a Category Four Hurricane at one point with winds of 145 mph in September, 2003. Responsible for eight deaths and $300 million dollars in damage, Fabian went down as the worst hurricane to strike the tiny resort island of Bermuda since 1926.
Hurricane Isabel–A very rare and powerful Category Five Hurricane, Isabel underwent rapid intensification and was able to stay at the highest level a hurricane can reach for over 30 hours, which made it one of the longest lasting Category Five Storms on record. Maximum sustained winds recorded were 160 mph, but gusts were as high as 234 mph. Although it eventually weakened, Isabel came ashore along the Outer Banks of North Carolina as a Category Two Hurricane, and was responsible for 16 deaths and $3.37 billion dollars in damage.
Hurricane Juan–Was the first hurricane to make landfall near Halifax, Nova Scotia in Canada in over a century. A Category Two Hurricane, Juan was responsible for four deaths, numerous power outages, tree damage, and went down as the most damaging hurricane in the history of Halifax.
Hurricane Alex–Was the first hurricane of the 2004 Atlantic Hurricane Season, and even became the season’s first major hurricane as well. Alex brushed the Outer Banks of North Carolina before turning out to sea in early August, 2004. With winds of 120 mph, it was a solid Category Three Hurricane.
Hurricane Charley–When it was all said and done, Hurricane Charley went down as the most devastating hurricane to hit anywhere in Florida since Hurricane Andrew in August, 1992. It also ended up being the second costliest hurricane in U.S. History behind Andrew. Charley fooled forecasters by not only rapidly intensifiying, but also making a turn to the north and east much sooner than anticipated, which spared the city of Tampa, but devastated the Port Charlotte area on August 13, 2004. Winds were as high as 145 mph, and the storm left at least 35 people dead, and $14 billion dollars in damage.
Hurricane Frances–Not as devastating as Charley, but still a very destructive storm due to its slow motion. Moving between 5 to 10 mph across the Florida Peninsula, Frances pounded just about all of the Sunshine state with Tropical Storm and Hurricane force winds for at least 24 hours on the Labor Day Weekend of 2004. Prior to that, the third major hurricane of the 2004 season rolled through the Bahamas with 145 mph winds. The storm left some 49 dead there while forcing the evacuation of 2.8 million people in Florida as well as knocking out power to about 6 million there as well. Frances was also responsible for producing 75 tornadoes. Final damage estimate is $9 billion dollars for the storm.
Hurricane Ivan–A classic Cape Verde storm that formed at unusually low latitude, Ivan rapidly developed into a Category Four Hurricane during the Labor Day Weekend of 2004 before briefly weakening to a Category Two for a period. However, as it moved through the extreme Southern Windward Islands of Barbados and Grenada, the storm strengthened back to major hurricane status, and destroyed 75 to 90 percent of all buildings on the island of Grenada. The storm then continued to re-energize, and reach Category Five status. It was the second Category Five storm in as many years after almost a five year drought following Mitch in October, 1998. It would eventually weaken somewhat, but it still made landfall near Gulf Shores, Alabama as a strong Category Three Hurricane with 130 mph winds. Moving farther inland, Ivan’s remains sparked torrential rains, flooding, and 123 tornadoes, which is second to Hurricane Beulah’s 150 in 1967. Ivan was responsible for some 124 deaths throughout the Caribbean and the Eastern United States. Final damage estimate from not only the U.S., but also the Caribbean totals $14.2 billion dollars.
Hurricane Jeanne–Originally not a powerful storm, Jeanne carved a path of death and destruction from Puerto Rico into Hispanola with 80 mph winds and heavy rains in September, 2004. The torrential rainfall produced floods and mudslides in Haiti, which left an estimated 1500 people dead in addition to 31 that were killed in Puerto Rico and the Dominican Republic. The storm has also been known for its erratic motion taking an eastward turn away from the United States after going through the Bahamas, and then turning southward, and westward back toward land. Jeanne finally made landfall in the United States along the South Central Coast of Florida near Stuart with winds of 120 mph. It was the fifth storm, fourth hurricane, and third major hurricane to impact the Sunshine State in 2004. After impacting Florida, the storm spread northward into the Southeast, Mid-Atlantic, and Northeast, where it produced flooding rains and tornadoes. Total death toll was estimated to be over 3,000, and the final damage total is estimated to be $6.9 billion.
Hurricane Dennis–Was a rare powerful July hurricane that formed in the Southeastern Caribbean a few hundred miles to the West-Northwest of Grenada on the evening of July 4th, 2005. Gradually strengthening in the days that followed, Dennis brought heavy rains to Jamaica, the Caymans, and Hispanola, but bore the brunt of its assault on Cienfuegos, Cuba with 150 mph winds. The coastal Cuban community was devastated as telephone poles and wires were knocked down. Just missing Category Five strength on the Saffir-Simpson Scale, Dennis cross the narrow, but rugged terrain of Cuba, and re-emerged in the Gulf of Mexico as a Category One storm before rapidly intensifying to a Category Four Hurricane in the early morning hours of July 10th, 2005. Dennis eventually made landfall near Pensacola, Florida on the afternoon of July 10th. So far, the death toll from the storm stands at 32, and inital damage estimates range from $1 billion to $2.5 billion.
Hurricane Emily–Was another rare powerful July hurricane that formed in the Atlantic on the heels of Hurricane Dennis during the week of July 10th, 2005. The storm became the most powerful hurricane ever recorded in the month of July after its winds reached a peak speed of 160 mph, and its minimum central pressure dropped to 929 mb, or 27.43 inches of Hg. This just surpassed the levels previously established by Dennis, and made it the first Category Five Hurricane of the 2005 season. Three more Cat Fives would follow. Although Emily ransacked the island of Grenada, which was still recovering from Hurricane Ivan’s impact in September, 2004, the storm mercifully spared the islands of Jamaica and the Caymans as well as weakened before making landfall in the Yucatan. The storm did regain some steam after losing its punch over the plateau of the Yucatan Peninsula, and made a final landfall as a major hurricane in Northeastern Mexico with winds of 125 mph. The storm was responsible for 64 deaths, and initially $300,000,000 dollars in damage. It also contributed to the rise in oil prices by forcing the evacuation of employees of Mexico’s primary oil company, PEMEX, from their offshore rigs in the Gulf of Mexico.
Hurricane Katrina–Started out modestly on August 23rd, 2005 in the Bahamas as a tropical wave that emerged from the remnants of a tropical depression that had been in the Caribbean. It gradually grew into the season’s eleventh named storm and fourth hurricane prior to making landfall in South Florida as a minimal hurricane with maximum sustained winds of 80 mph, and gusts up to 95 mph. After quickly crossing Southern Florida, Katrina emerged again over water in the Southeastern Gulf of Mexico near the Florida Keys, and strengthened to the 2005 season’s third major hurricane before reorganizing into the most powerful storm in the Central Gulf since Hurricane Camille, and fourth Category Five Hurricane in three years with winds as high as 175 mph, and a minimum central pressure of 902 mb, or 26.64 inches of Hg. It became the fourth most powerful hurricane of all time ahead of Camille and behind Hurricane Gilbert (1988), the Labor Day of Hurricane of 1935, and Hurricane Allen(1980). After coming ashore as a Category One Hurricane in South Florida, Katrina struck two more times along the Gulf Coast. First in Buras, Louisiana with 140 mph winds, and then near Bay St. Louis, Mississippi with 135 mph winds. It created a 27 foot storm surge in Gulfport, Mississippi and a 22 foot storm surge in Bay St. Louis. Winds as high as 90 mph were felt as far east as Mobile, Alabama, which experienced its worst flooding in 90 years. To make matters worse, part of an oil rig broke away in Mobile Bay and hit a nearby causway possibly causing damage there. Waves as high as 48 feet happened offshore in the Gulf of Mexico. Some 50 people were killed in coastal Mississippi including 30 in an apartment complex in Biloxi. Katrina even ripped off part of the roof of the Louisiana Superdome, where 10,000 people were staying in the facility, which was being used as a shelter of last resort. Extensive flooding occurred in New Orleans, which was actually spared the brunt of the storm. The 9th ward in the Crescent City was underwater as well as 80 percent of the city. People fled to their attics to escape drowning and some were rescued by helicopters and boats. So far, the latest death toll is at 1,833 (Louisiana-1582, Mississippi-170, Florida-30, Alabama-48, Georgia-2, Tennessee-1 with damage estimates now are up to $81 billion. Experts fear that the total cost for the storm could be $200 billion dollars, which would make Katrina the costliest hurricane and natural disaster in United States History.
Hurricane Rita–The seventeenth named storm and fifth major hurricane of the 2005 season, Rita began near the Turks and Caicos Islands as a mere tropical depression on September 17th, 2005. However, as it passed near the Florida Keys and South Florida, Rita blossomed into the season’s ninth hurricane, and brought sustained winds of Category Two strength with gusts over 100 mph. Continuing to strengthen, Hurricane Rita became a major hurricane on September 21st, 2005 as its eye experienced a 77 millibar drop in just 39 hours. The storm, which followed a similar track to the devastating Hurricane Katrina, which struck New Orleans and the Mississippi Gulf Coast on August 29th, 2005, became the third Category Five Hurricane to emerge in 2005 with 175 mph winds, and a minimum central pressure of 897 mb, or 26.49 inches of Hg. Hurricane Hunters also found wind gusts as high as 235 mph. With those statistics, Rita is not only the most powerful hurricane of 2005 so far, but it is also now third on the all time list ahead of Katrina and Hurricane Allen, and behind only Hurricane Gilbert (1988) and the Labor Day Hurricane of 1935. The approach of Rita to the Western Gulf Coast, prompted the evacuation of some 2.7 million people. Poor planning led to traffic jams and cars running out of gas in Texas. A usual four hour trip from Houston to Dallas ended up taking as long as 18 hours. Prior to making landfall, the storm had already caused problems including the deaths of 107 people trying to flee the storm, flooding in Galveston, and breeches in the New Orleans levee system that was severely damaged by Hurricane Katrina a month earlier. Twenty-four of those people that died during evacuation were in a bus that had a fire and explosion on Interstate 45 south of Dallas, Texas, Rita finally made landfall in the Sabine Pass area of the Texas/Louisiana border in the early morning hours of September 24th, 2005 bringing with it wind gusts as high as 111 mph in Cameron, Louisiana, and heavy damage in Lake Charles and Vermillion Parish. Approximately 1.1 million people were initialy without power in Texas and Louisiana. Damage estimates from the storm are currently $6 billion dollars, and 54 people were directly killed by the storm including five who lost their lives in an Apartment Complex in Beaumont, Texas, a man, who lost his life when a tornado struck in Northern Mississippi, and an East Texas man, who died at the hands of a fallen tree.
Hurricane Stan–The eighteenth named storm, and tenth hurricane of the 2005 Atlantic Hurricane Season started out modestly, and only was a Category One Hurricane on the Saffir-Simpson Scale when it made landfall over Southern Mexico, but the heavy rains it produced resulted in a deadly toll. Unofficially, as of this time, there have been up to 1,500 deaths in Guatemala, Mexico, El Salvador, Honduras, Nicaragua, and Costa Rica. Officially, there have been 796 deaths so far throughout Mexico (71 dead) and Central America including 652 in Guatemala, and another 71 in El Salvador. In addition, the Mexican Government estimates that damage from Stan will cost approximately $1.9 billion U.S. Dollars while crop damage in El Salvador is estimated to be about $10 million. The death toll reported so far with Hurricane Stan makes this storm among the most deadly of all time, and may even surpass the tally accumulated by Hurricane Katrina along the Gulf Coast of the United States. Reasons for the high death toll is that the heavy rains from the dissipating storm produced severe flooding and mudslides. Rainfall amounts ranging between 15 to 20 inches was reported in the region.
Hurricane Vince–Well…Ok, you probably think that this storm was nothing special, but it actually was for several reasons. Forming in the second full week of October, 2005, Vince not only became the 20th named storm and 11th hurricane of the busy 2005 season, but it also marked the first time since the naming of storms began in 1950, that a season reached the “V” named storm. The previous mark was set in 1995 when that season reached the “T” named storm. It also set history in a couple more ways as well. Forming in the vicinity of the Madiera Islands in the Northeastern Atlantic, Hurricane Vince was the first hurricane on record to form in this region. In addition, Vince became the first tropical cyclone of any kind to make landfall in Spain as it made landfall in the Southwestern portion of the Western European country near Huelva on October 11, 2005 as a tropical depression with 35 mph winds and a minimum central pressure of 1002 mb, or 29.59 inches.
Hurricane Wilma–There is no question about this one being on the list. Wilma started out modestly as the 24th depression of the 2005 Atlantic Hurricane Season on Saturday, October 15th, and battled some ups and downs that weekend, but over time the storm would become a monster. In a span of 36 hours from Tuesday morning, October 18th to Wednesday afternoon, October 19th, the barometric pressure in the storm dropped some 102 mb to an all time low for pressure in the Atlantic Basin of 882 mb, or 26.05 inches of Hg. Maximum sustained winds increased to 175 mph. Wilma is now the strongest storm all time in the Atlantic surpassing the mark set by Hurricane Gilbert in 1988 (888 mb). It also was the 21st named storm, 12th hurricane, and 6th major hurricane of 2005, which equaled marks for storms in 1933 and hurricanes in 1969. Wilma was the fourth Category Five Hurricane to form in the season as well joining Katrina and Rita, which are also among the five or six strongest storms on record. After reaching its peak, Wilma gradually decreased in intensity to a strong Category Four with 140 mph before making its first landfall over Cozumel, Mexico on Friday, October 21, 2005. Six hours later on Friday night, Wilma slowly moved over the Yucatan as it made a second landfall in Cancun. After bringing hurricane force winds to the Yucatan for over 24 hours, the storm gradually departed, and moved out over the Southern Gulf of Mexico, where it was picked up by a trough over the Eastern United States, and carried across Florida. Moving as fast as 25 miles per hour to the Northeast, Wilma made a third landfall over Cape Romano, Florida some 22 miles to the south of Naples, and brought with it winds of Category Three strength at 125 mph. Wilma had a devastating effect on much of the East Coast of South Florida including Fort Lauderdale, which experienced its worst hurricane in 55 years. Nearby in Key Biscayne wind gusts were as high as 116 mph while they were 95 at Opa Locka Airport outside Miami. Between three and six million people were left without power in the hours after the storm. Waves as high as 45 feet came over the sea wall, and battered the capital of Havana in Cuba. Swells as high as 50 feet were also reported. The storm has already killed some 48 people in Florida (31 deaths), Mexico and throughout the Caribbean including places as far away as Haiti. Initial damage estimates are said to be $10 billion dollars.
Tropical Storm Alpha–Not too many tropical storms get mentioned in this list unless they are record breakers, or what we call storms of the unusual. Alpha does meet this criteria as it was the 22nd named storm to form in the Tropical Atlantic during the 2005 Atlantic Hurricane season, which broke the record previously set in 1933 with 21 storms. It also marked the first time since names have been used in the Atlantic (since 1950) that a second list of storm names was used for the same season. There have also been 12 hurricanes in 2005, which equaled the mark set in 1969, and 6 major hurricanes including three Category Five storms, which is also a record. So far, Alpha has been responsible for some 26 deaths in the Caribbean.
Hurricane Beta–Like Alpha, Beta is an historic storm for different reasons. Only a Category One Hurricane on the Saffir-Simpson Scale on October 28th, 2005, Beta originally developed in the extreme Southwestern Caribbean on October 26th, 2005. It became the 23rd named storm of the season, and then strengthened to the 13th hurricane of the season as well. With winds of 90 mph, and a minimum central pressure of 28.79 inches of Hg, Beta became a record breaking hurricane by placing 2005 in the history books again with the most hurricanes in a season. 2005 broke the previous mark set in 1969 with 12 hurricanes. On the morning of October 29th, Beta strengthened to its peak intensity as a major hurricane with 115 mph winds and a minimum central pressure of 28.35 inches of Hg. making it the seventh major hurricane of the 2005 season. That tied the season for second all time for most major hurricanes with 1961, which also had seven major storms. 1950 had the most major hurricanes with eight. The storm would finally make landfall in Nicaragua some 50 miles to the north of Bluefields on October 29th.
Hurricane Dean–The fourth named storm of the 2007 Atlantic Hurricane Season not only became the first hurricane, but also the first major hurricane of that season. Forming in the Eastern Atlantic on August 13th, it was the first real Cape Verde storm of 2007. Gradually strengthening, Dean grew to have maximum sustained winds as high as 165 miles per hour with gusts up to 200 miles per hour, which classified it as a Category Five Hurricane on the Saffir-Simpson Scale. Its minimum pressure dropped as low as 906 millibars, or 26.75 inches of Hg (Mercury), which was stronger than Hurricane Ivan back in September 2004, and right behind hurricanes Camille (1969) and Mitch (1998) among the all time most powerful storms recorded in the Atlantic. Dean also became the third most intense hurricane to make landfall in the Atlantic Basin behind the Labor Day Hurricane of 1935, and Hurricane Gilbert. Following a similar track to that of both Ivan in 2004 and Gilbert in 1988, Dean moved through the central portion of the Lesser Antilles including Dominica and Martinique, then moved south of Puerto Rico, the Virgin Islands, and Hispaniola before battering the island nation of Jamaica as its eye just brushed its southermost point. The storm also bypassed the Cayman Island chain before coming ashore in the Yucatan Peninsula near the towns of Costa Maya and Majahual, which is 40 miles to the East-Northeast of Chetumal at 4:30 PM EDT on August 21, 2007. After being over the Yucatan for about twelve hours, the storm re-emerged in the Bay of Campeche as a minimal hurricane, but gradually re-strengthened to a Category Two storm with 100 mph winds when it made a second landfall along the Mexican coastline in the early afternoon of August 22, 2007 near Gutierrez Zamora some 40 miles South-Southeast of Tuxpan. The latest death toll has the storm leaving behind forty-five people dead including twenty-five in Mexico, and twenty throughout the Caribbean including nine in Haiti, six in the Dominican Republic, two in Dominica, two in Jamaica, and one in St. Lucia. The storm has so far caused some $2 billion in damage including a battering of the oil fields for the Mexican national oil company, PEMEX, and shutting down a plant run in Jamaica by Pittsburgh based Aluminum producer, Alcoa.
Hurricane Felix–The fifth named storm of the 2007 Atlantic Hurricane Season not only became the second hurricane, and major hurricane of that season, but also the season’s second Category Five Hurricane. Forming over two weeks after Hurricane Dean in the Eastern Atlantic on August 31st, it was the second Cape Verde storm of 2007. Rapidly strengthening in the very warm waters of the Southern Caribbean during the Labor Day Weekend, Felix grew to have maximum sustained winds as high as 165 miles per hour with gusts up to 200 miles per hour, which classified it as a Category Five Hurricane on the Saffir-Simpson Scale. After the storm experienced a fall of 78 millibars in 52 hours, Felix’s minimum pressure dropped as low as 929 millibars, or 27.43 inches of Hg (Mercury) which was stronger as Hurricane Michelle from late October, 2001 and as strong as Hurricane Emily from July, 2005 among the all time most powerful storms recorded in the Atlantic. Its pressure drop is second all time to Hurricane Wilma from October 2005, which was 83 millibars in 12 hours, and ahead of Hurricane Allen (1980). Following a similar track to that of both Ivan in 2004 and Emily in 2005, Felix moved through the southern Windwards including Grenada, St. Vincent and the Grenadines, and their dependencies, then moved well south of Puerto Rico, the Virgin Islands, and Hispaniola before threatening the usually unscathed ABC islands of Aruba, Bonaire, and Curacao in the Nertherlands Antilles. The storm eventually bypassed Jamaica and the Caymans as well as the Colombian enclave of Isla de Providencia before coming ashore on the Northern Coast of Nicaragua near the city of Cabo Gracias A Dios as a Category Five Hurricane with sustained winds of 160 miles per hour, and a minimum central pressure of 935 millibars, or 27.61 inches. The storm then proceeded to cross Central America with heavy rains that produced flooding and mudslides in interior portions of Nicaragua, Honduras, Guatemala, and the Chiapas region of Southern Mexico. As of now, Felix is responsible for 130 deaths along coastal Nicaragua. Prior to landfall, Felix had reintensified into a Cat Five storm after weakening to a minimal Category Four storm with 135 mile per hour winds, and 160 mile per hour gusts late Sunday, September 2nd.
Hurricane Humberto–Putting this storm on the list is debatable. However, Hurricane Humberto from the 2007 Atlantic Hurricane Season is significant for several reasons. First, it was a storm that went from depression status to a Category One Hurricane on the Saffir-Simpson Scale with 85 mile per hour winds over a span of just 14 hours. In addition, the storm’s formation in the oil platform rich area of the Western Gulf of Mexico pushed oil prices up to over $80 per barrel. Finally, and most significantly, Humberto’s landfall was the first landfall by an Atlantic Hurricane along the U.S. coastline since Hurricane Wilma back in October 2005. The storm crossed the Texas shoreline near High Point, Texas, and peaked at 85 mile per hour winds, 105 mile per hour wind gusts, and a barometric pressure as low as 29.12 inches of Hg (Mercury), or 986 millibars. The storm left approximately $500 million dollars in damage in Texas and Louisiana.
Hurricane Noel–Like Humberto, it was a minimal storm, but this Category One Hurricane was the deadliest and most costly hurricane of the 2007 Atlantic Hurricane Season. The storm, which formed 185 miles South-Southeast of Port-Au-Prince, Haiti left some 163 people dead as well as 59 missing. In addition, Noel left behind some $742 million in damages including $500 million on the island of Cuba alone. Maximum sustained winds were 80 miles per hour with gusts up to 95 miles per hour. Minimum central pressure dropped to 28.94 inches, or 980 millibars.
Tropical Storm Fay–The storm was the first in a series of four storms to affect the United States over a span of a month. This one was the weakest of the four, but it did cause its share of problems with torrential rains, especially across Florida. Flooding was extensive in East Central Florida including Brevard county. In that county, some 15,000 homes were flooded and another 93,000 were left without power from the gusty winds. Areas that were hit harder were more rural. The storm also wreaked havoc in Hispaniola where it interacted with the mountainous terrain there producing torrential rains. Thankfully, there were only 13 direct and eight indirect deaths from the storm in Haiti, Dominican Republic, and Florida. The storm caused some $560 million dollars in damage including $195 million in Florida, $25 million in Georgia, and another $25 million in Alabama.
Hurricane Gustav–Almost three years to the day that Hurricane Katrina made landfall along the Gulf Coast, Gustav emerged in the Caribbean where it pounded Western Cuba before moving into the Gulf, and giving another scare to residents in Louisiana and Mississippi. The storm strengthened to near Category Five strength with 155 mile per hour winds. Barometric pressure in the eye of the storm dropped to 27.79 inches of Hg, or about 941 millibars. The storm made six total landfalls including four as a hurricane. Gustav moved over the Isle of Youth near Cuba with winds of 145 miles per hour. It made another landfall in Cuba near Los Palacios with 155 mile per hour winds. The storm eventually came ashore along the Gulf Coast of the U.S. near Cocodrie, Louisiana with winds of Category Two strength of 105 miles per hour. Gustav left some 153 people dead and approximately $4.3 billion in damage.
Hurricane Hanna–Formed on the heels of Hurricane Gustav, but didn’t have the same punch of her predecessor. Peaking at moderate Category One strength with 85 mile per hour winds. However, it still caused a great deal of death and destruction in the Caribbean. The storm took a track that eventually took it up the Eastern Seaboard during the weekend after Labor Day. Hanna was briefly a hurricane when it was over the Caicos Islands. It made a United States landfall as a tropical storm over the border between North and South Carolina. The storm was a major rainmaker bringing torrential rains to Haiti, where nearly 800 people were killed by flooding from the storm. Hanna eventually impacted the Garden State, where it actually strengthend for a while to have 55 mile per hour winds near Atlantic City. It dumped torrential rains on New Jersey along with gusty winds. In total, the storm caused some $160 million in damage.
Hurricane Ike–This storm was the most significant of the 2008 Atlantic Hurricane Season. It was the first big storm to make landfall in Galveston, Texas since Hurricane Alicia in 1983. The storm is also the third costliest storm in U.S. history with estimates between 25 and 29 billion dollars. Only Hurricane Katrina (2005) and Hurricane Andrew (1992) were more devastating. The storm peaked at Category Four strength with 145 mile per hour winds and a minimum central pressure of 27.61 inches of Hg, or 935 millibars. When it came ashore at Galveston, Ike had winds of 110 miles per hour, and a minimum central pressure of 950 millibars, or 28.05 inches of Hg. The hurricane made several landfalls including two in Cuba, and one in the Bahamas before coming ashore in Texas. After blowing through Galveston, Ike wasn’t finished as its remnants moved into the Midwest andOhio Valley. There, at least 28 direct and indirect deaths were reported in Tennessee, Ohio, Indiana, Illinois, Missouri, Kentucky, Michigan, and Pennsylvania. In total, Ike left 103 people dead. In Ohio, the storm rivaled the Super Outbreak of 1974 as the costliest natural disaster in state history with $1.1 billion in damage. The remnants of Ike even made an impact on Canada where 50 mile per hour winds downed power lines in Southeastern Ontario and Quebec.
Hurricane Paloma–Was the last named storm and hurricane of the 2008 season. Affecting the Western Caribbean, Paloma became the second strongest hurricane on record in the Atlantic during the month of November behind Hurricane Lenny (1999). The storm peaked at Category Four strength with 145 mile per hour winds and a minimum central pressure of 27.88 inches of Hg, or about 944 millibars. Paloma affected the Cayman Islands and Western Cuba, where it made two landfalls near Santa Cruz del Sur and Camaguey. Maximum sustained winds at landfall were 85 knots or 100 miles per hour while minimum central pressure was 970 millibars, or 28.64 inches of Hg. While the storm was not blamed directly or indirectly for any deaths, it did cause $15 to $20 million dollars in damage in the Caymans with the heaviest damage there to Little Cayman and Cayman Brac. Cuba suffered some $300 million in damage with over 12,000 homes damaged, and another 1,500 destroyed.
Hurricane Igor–A vast and powerful Cape Verde storm, Igor eventually became the strongest hurricane of the 2010 season. At peak intensity, Igor was a strong Category Four storm on the cusp of Cat Five intensity with sustained winds of 155 miles per hour. The storm went through several flucutations in intensity thanks to eyewall replacement cycles, but remained resilient. Eventually made landfall in Bermuda as a Category One hurricane before slamming into Newfoundland as a stronger storm, which turned out to be the most devastating in that Canadian province’s history. At one point, Igor had a wind field that was 740 nautical miles across according to a report filed on it by the National Hurricane Center. The storm lasted 15 days, and had a minimum central pressure of 924 millibars, or 27.29 inches of Hg. Three people were killed either directly or indirectly by the storm, which also caused approximately $200 million dollars in damage in Newfoundland. Igor’s name was retired in 2011, and replaced by Ian for the 2016 season.
Hurricane Irene–The ninth named storm of the 2011 Atlantic Hurricane Season was the only storm to be retired from that season. It was a major hurricane that fell just shy of Category Four intensity on the Saffir-Simpson Scale. Irene was the first landfalling hurricane in the United States since 2008 when Hurricane Ike crashed into Galveston. The storm lashed the Bahamas before taking aim on the East Coast of the United States. Irene put New York City under a Hurricane Warning for the first time since 1985. The storm was the only the third hurricane to make landfall in New Jersey, and the first to make two landfalls there. The storm was the first to cross New York City since 1893. NYC had to shut down the subway system for the first time in that city’s history. Hurricane Irene would be remembered for the tremendous flooding it caused in New York, New Jersey, and Vermont. Approximately 65 million people were affected by the storm. A total of 21 people were killed across 8 different states. Pressure dropped to 970 millibars or 28.63 inches of Hg, which is a record for South Plainfield, New Jersey. Irene also dumped 5.34 inches in Northwestern Middlesex County adding to an already waterlogged August rainfall total. The storm also affected the Outer Banks of North Carolina, where it made its first landfall on August 26th. In the Tar-Heel State, some 225 roads and 21 bridges were shut down while two piers were destroyed. Initial insurance estimates had Irene causing some $10 billion dollars in damage while power companies guessed that approximately 4.5 million people were without power from the storm.Flooding and downed trees closed roads in Delaware; Tornado caused damage in the city of Lewes. Downed trees and power lines along with flooding closed about 200 roads in parts of Maryland. Widespread flooding, storm surge of up to 8 feet in Norfolk, and 11 inches of rain in Suffolk in Virginia.
Tropical Storm Lee–Was not a powerful storm, but it was a tremendous rain maker, especially by the time it got into the Mid-Atlantic, where its remnants dumped torrential rains on the Susquehanna Valley region of New York, Pennsylvania, and Maryland. Places such as Binghamton (New York), Scranton (Pennsylvania), Wilkes-Barre (Pennsylvania), and many towns and villages along the long flowing river, experience historic flooding. New Jersey wasn’t spared either with some downpours from the outer fringes of what was left of Lee adding almost another five inches of rain to areas of the Garden State that didn’t need it.
Hurricane Ernesto–The fifth named storm of the 2012 Atlantic Hurricane Season was not particularly a powerful, deadly, or devastating storm. However, it was the first hurricane to make landfdall anywhere in the Atlantic Basin, and it had the unique distinction of being a rare Atlantic storm that crossed Mexico to become a system in the Eastern Pacific (Tropical Storm Hector). Peak intensity with Ernesto was only 85 mile per hour winds as it lashed much of the Southern Yucatan.
Hurricane Isaac–The ninth named storm and fourth hurricane of the 2012 Atlantic Hurricane season was a much more devastating storm than its Category One storm stats would suggest. Even though it had only maximum sustained winds of 80 miles per hour, its size, low pressure, and duration, made it a relentless storm that pummeled the Northern Gulf coast from Louisiana eastward to the extreme Western Florida Panhandle. The storm even generated feeder bands that produced storms that dumped over 5 inches of rain in South Carolina, hundreds of miles away from the storm’s center. Barometric pressure bottomed out at 968 millibars, which was more characteristic of a Category Two Hurricane. The storm made impacts across the Caribbean in Hispaniola and Cuba before finally becoming a hurricane prior to making two landfalls in Louisiana. Isaac generated impressive storm surge totals for a Category One storm including 11 feet above normal just outside of New Orleans. Issac was a slow mover with a forward motion of only 5 to 6 miles per hour across Louisiana. After making landfall, the storm only moved some 60 miles over a span of 24 hours.
Hurricane Sandy–Also known as Superstorm Sandy, this hurricane did strengthen to a Category Three Hurricane with maximum sustained winds of 115 miles per hour prior to its first landfall in Cuba. At the height of its powers, Hurricane Sandy had tropical storm winds extend some 1,000 miles from its center of circulation, and its entire diameter encompassed some 2,000 miles. Minimum central pressure dropped to 940 millibars, which wound up being the lowest pressure ever recorded north of Cape Hatteras, North Carolina. The storm, which originated in the Southwestern Caribbean near Jamaica, and produced a variety of weather including: high winds, rain, waves, storm surge, tornadoes, and even blizzard conditions, would make its biggest impact to the Mid-Atlantic as it moved up the Eastern Seaboard, and then made a dramatic and unprecedented left turn into the Jersey Shore near Atlantic City. Besides making this rare left turn into New Jersey, the storm, which began undergoing a transition to an extratropical system, re-energized to have winds of 90 miles per hour just hours before coming ashore. Once it came inland over the Garden State, Sandy produced strong winds of up to 70 miles per hour at Greg’s Weather Center in South Plainfield, which uprooted trees, downed power poles and power lines, smashed traffic lights, and damaged windows and store signs. At the coast in South Amboy, a record storm surge that was as high as 13.3 feet at Sandy Hook and King’s Point in New York, destroyed vegetation, brought boats and ships ashore, ripped up walkways, tore down fences, and wiped out some nearby homes. Down the coast in the Union Beach section of Hazlet, many homes and businesses were wiped clean. Nearby towns of Keyport and Keansburg also experienced significant damage. Further to the north, a record surge of 13.88 feet occurred in New York Harbor, and produced flooding in Lower Manhattan and Hoboken. Significant flooding also occurred in the area of the Hackensack River including towns: Hackensack, South Hackensack, Little Ferry, and Moonachie. Superstorm Sandy caused power failures in 17 states and originally left some 8.2 million people without power. The storm impacted weather in West Virginia and as far west as Lake Michigan, where waves rose as high as 20.3 feet. An estimated total of 60 million people were affected by the storm, and 33 were left dead in the United States. Another 69 were killed in the Caribbean for a death toll of 102. Of those dead in the United States: 18 were killed in New York including 10 in New York City, 6 people were killed in New Jersey, and 4 were killed in Pennsylvania.
Hurricane Humberto–Was the first of two hurricanes in 2013 after a very busy 2012 season. It didn’t become a hurricane until the early morning hours of September 11th. Humberto’s formation near mid-September was the latest a hurricane had formed during the active cycle that had started in 1995. The storm didn’t cause any damage or casualties as it trekked through the Eastern and Central Atlantic affecting the Cape Verde Islands and the Azores. Maximum sustained winds topped out at 90 miles per hour while minimum central pressure dropped to 979 millibars, or 28.91 inches.
Hurricane Ingrid–Was the one storm retired from the 2013 season. It only grew to be a Category One Hurricane with maximum sustained winds of 75 knots or 85 miles per hour with a minimum central pressure of 983 millibars, or 29.03 inches of Hg. However, this storm managed to become a potent and deadly storm thanks to the tremendous amounts of rain it produced. According to the National Hurricane Center, Ingrid dumped 20.11 inches of rain in Tuxpan, Mexico as well as 14.46 inches at La Pesca, and 19.38 inches at Paso de Molina. Only 32 deaths were attributed to the storm in Mexico, and damage was estimated to be as high as $230 million.
Hurricane Edouard–Became not only the first major hurricane in the Atlantic in 2014, but also since Hurricane Sandy in October 2012. The storm strengthened to have maximum sustained winds of 120 miles per hour, and a minumum central pressure of 955 millibars, or 28.20 inches of Hg. While the storm was so powerful, it stayed away from land as it traveled around the Eastern and Central Atlantic from about several hundred miles to the west of the Cape Verde Islands to about several miles to the west of the Azores. No deaths or damage were attributed to this storm, but it ended nearly a two year drought of major hurricanes in the Atlantic.
Hurricane Fay–Was a short lived October 2014 hurricane that lasted only four days, but became the first hurricane to make landfall over the island of Bermuda since 1987 when Emily came ashore there. The storm peaked at 80 mile per hour winds and 983 millibars or 29.03 inches of Hg. The storm produced some 14 inches of rain on the island, downed utlity poles and trees, and street signs. Approximately 27,000 people were left without power on the island, and original estimates of $3.8 million in damage.
Hurricane Gonzalo—A storm that was fast on the heels of Hurricane Fay in October 2014, Gonzalo developed in the Western Atlantic to the East of the Lesser Antilles, and grew to be a strong Category Two Hurricane on the Saffir-Simpson scale when it came through Bermuda. At peak intensity, Hurricane Gonzalo had maximum sustained winds of 125 miles per hour with a minimum central pressure of 940 millibars or approximately 27.76 inches of Hg (Mercury). The storm was responsible for three deaths in the Leeward Islands, but none in Bermuda. Gonzalo left approximately $200 to $400 million in damage on Bermuda.
Hurricane Joaquin—The most powerful storm in the Tropical Atlantic during the 2015 season, Joaquin was a Category Four Hurricane on the Saffir-Simpson Scale with peak sustained winds of 135 miles per hour and a minimum central pressure of 931 millibars or E27.49 inches of Hg. The hurricane hammered the Bahamas island chain with Crooked Islands, Long Cay, Acklins Island, Long Island, Rum Cay, San Salvador, Mayaguana, and Exuma. Storm surge was as high as 12 to 15 feet in Rum Cay, Crooked Island, and Acklins. There was also anywhere from 5 to 10 inches in the Central and Southeastern Bahamas. The Turks and Caicos islands were also affected as well as Haiti, Cuba, and Bermuda. The storm also combined with another low pressure system in the Eastern United States to produce significant flooding in South Carolina, and heavy rains and nor’easter like conditions as far north as New Jersey. Charleston Airport in South Carolina repoorted a one day rainfall total of 11.50 inches on October 3rd, and a four day total of 17.29 inches over the first four days of October. The storm left 34 people dead including thirty-three on the El Faro, a ship that was sunk by the storm, and caused some $60 million in damage in the Bahamas.
Hurricane Patricia—This was a powerful storm in the Eastern Pacific, which became the strongest hurricane ever recorded in the Western Hemisphere. Intensifying to a Category Five Hurricane on the Saffir-Simpson Scale thanks in large part to the extremely warm waters of the Eastern Pacific resulting from an El Nino, Patricia had maximum sustained winds of 185 miles per hour with gusts well over 200 miles per hour while its minimum central pressure dipped to 872 millibars, or approximately 25.75 inches of Hg (Mercury). The strongest storm prior to that was Hurricane Wilma in the Atlantic in October 2005, which had a lowest pressure of 882 millibars, or 26.05 inches of Hg. The storm eventually came ashore in the sparsely populated region of Southwestern Mexico and left six people dead, and caused some $325 million dollars in damage.
Hurricane Matthew—Was the 13th named storm of the 2016 Atlantic Hurricane Season, and it lasted some 11 days from late in September into early October as it reached Category Five strength on the Saffir-Simpson Scale and became the deadliest storm in the Atlantic Basin since Hurricane Stan in 2005. Matthew was responsible for 585 total deaths: 546 in Haiti, 34 in the United States, 4 in the Dominican Republic, and one in St. Vincent and the Grenadines. Matthew’s peak winds reached 165 mph while its minimum central pressure dropped to 934 millibars or 27.58 inches of Hg.
Hurricane Otto—Affected Southern Nicaragua and Costa Rica from November 20-26, 2016. Otto was the first hurricane to ever affect Costa Rica. Otto was also the latest hurricane to form in the Caribbean Sea. It was also the southernmost hurricane landfall in Central America.
Otto’s peak intensity was at 115 mile per hour winds and a minimum central pressure of 975 millibars, or 28.79 inches. The storm was repsonsible for 18 direct deaths in Central America, and an estimated $15 million in damage to Costa Rica’s coffee industry.
Hurricane Harvey—Became the first major hurricane in almost 12 years to make landfall in the United States, and the strongest Category Four system to make landfall in Texas since Hurricane Carla back in 1961. Harvey was a system that originated off the West African Coast and stayed far to the south before moving into the Winward Islands as a minimal tropical storm. After Harvey went into the Central Caribbean, it dissipated into the open wave. Its remnants then crossed over land into the Yucatan Peninsula. Harvey’s remains moved back out over the open waters of the Gulf of Mexico, where it rapidly intensified into the strongest storm to date in the 2017 season. Harvey became a Category Four Hurricane with 130 mph winds and a minimum central pressure of 938 millibars, or 27.70 inches of Hg when it came ashore near Rockport, Texas on August 25, 2017. The storm remained a hurricane for 15 hours, and a tropical storm for about 48 hours. Harvey produced tremendous rainfall amounts in the Houston area. When it is all said and done, there could be as much as 50 inches of rain in portions of Southeastern Texas.


 By Dr. Jay Lehr and Steve Goreham ~
 “
“
 By Clay Waters ~
 The praise for the humanity-loathing human began at the start. Not even Tucker Carlson could hamper Knight’s good vibes.
 By David Wojick, Ph.D. ~
 The $800 billion a year is from a report presented by Colombia at COP27. The mainstream green press either did not notice or decided to ignore it, lest it raise issues best left alone until the proposed UN Loss and Damage Facility is created.


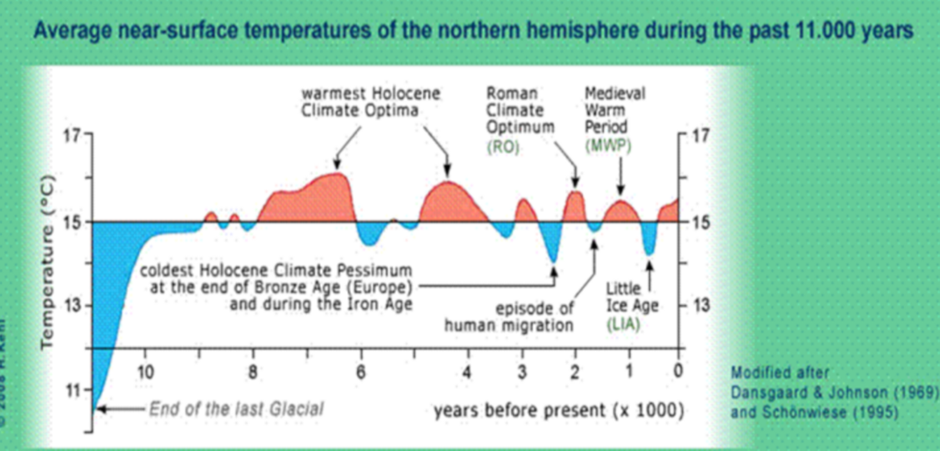


 By Bonner Cohen, Ph.D. ~
 These two sentences, which run counter to everything you may have heard about the “climate crisis” said to be plaguing the planet, introduce a provocative new study by Indur Goklany, Ph. D. A widely published author and longtime researcher into a variety of scientific fields, Goklany strips carbon dioxide of its status as an environmental villain as decreed by modern-day climate orthodoxy. He also shows that rising atmospheric levels of CO2, including those produced by fossil fuels, are highly beneficial to biodiversity.


 By Anton Lang ~


 By Vijay Raj Jayaraj~
 Coal-fired plants produce more than 70 percent of all electricity consumed by India’s 1.3 billion people. Indicating greater demand, coal-based electricity registered a 3.12 percent increase in March 2022 compared to a year ago. Coal shortages can have a devastating effect on the Indian economy.


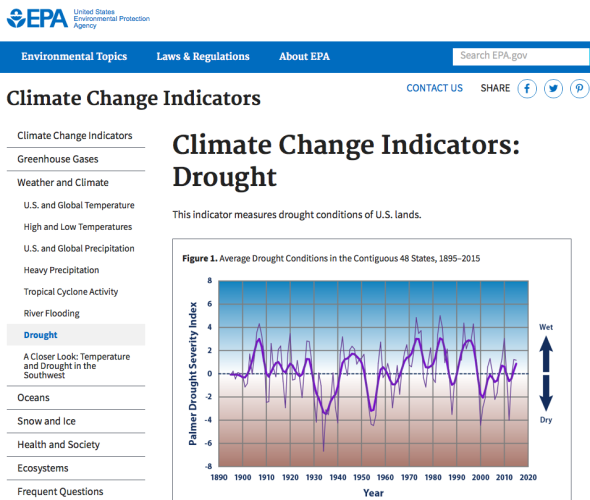
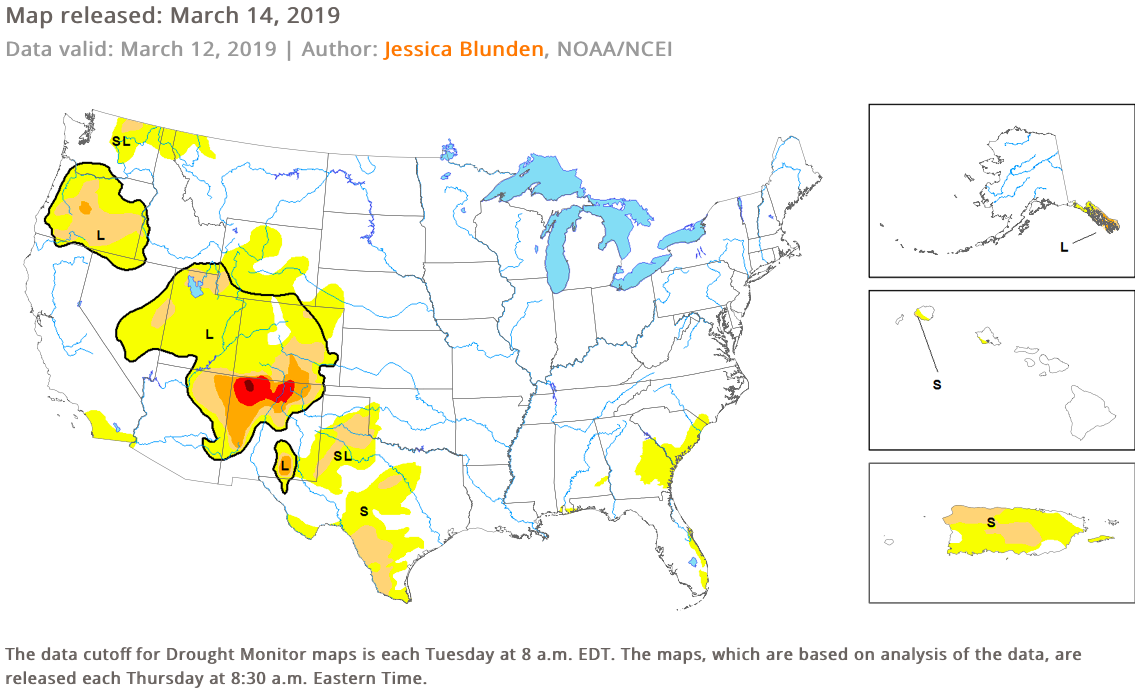
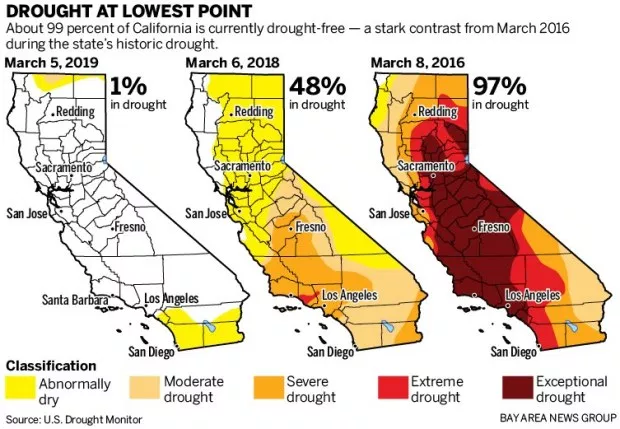
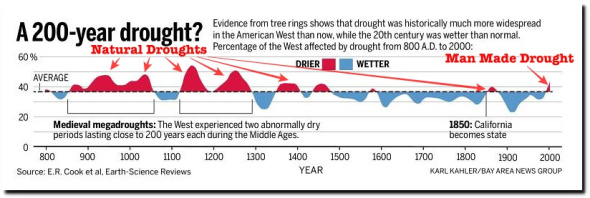
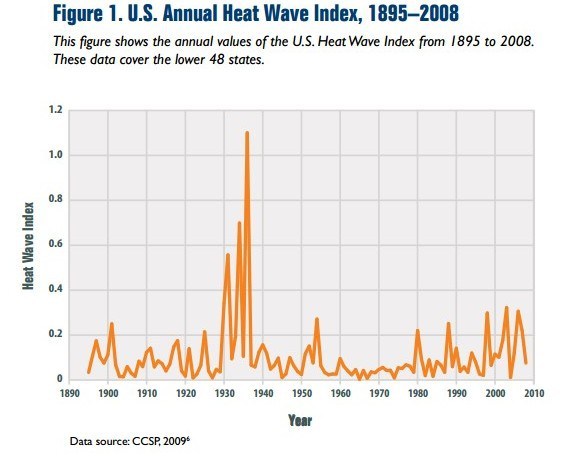


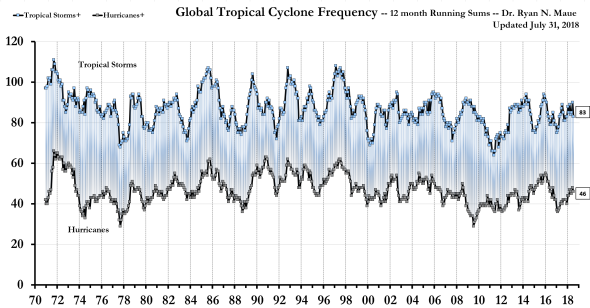
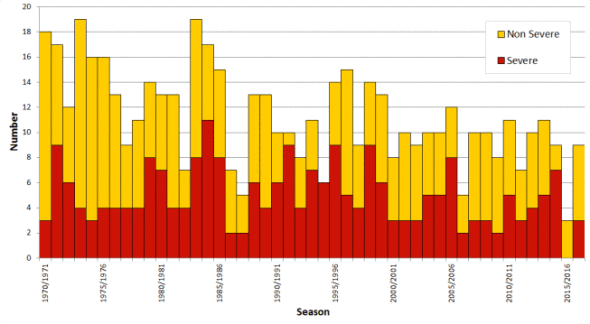

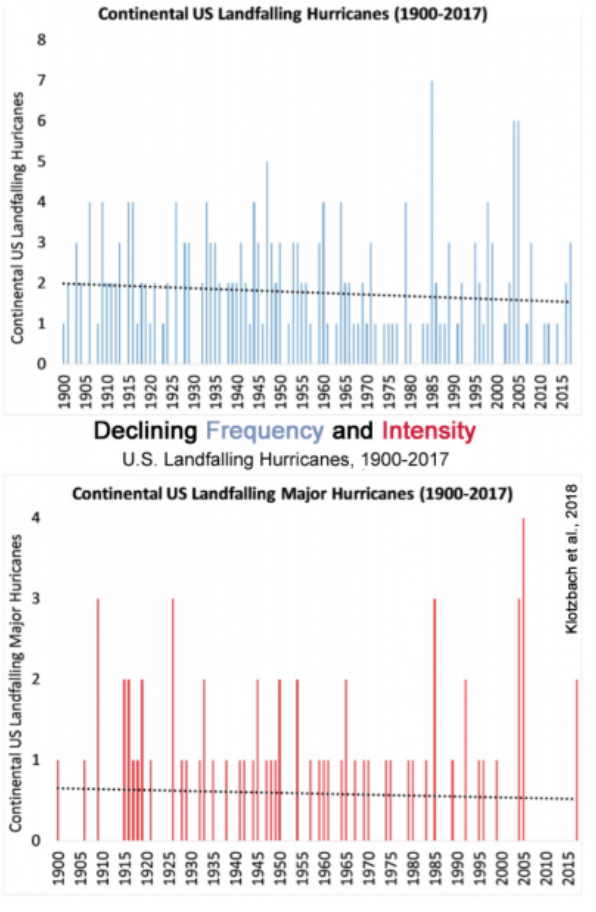
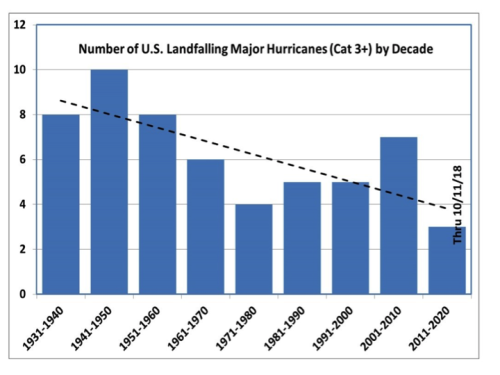
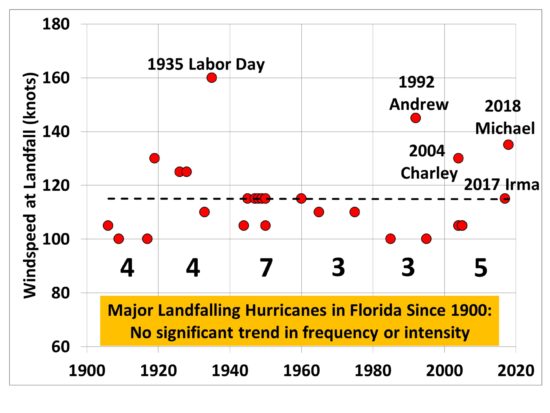
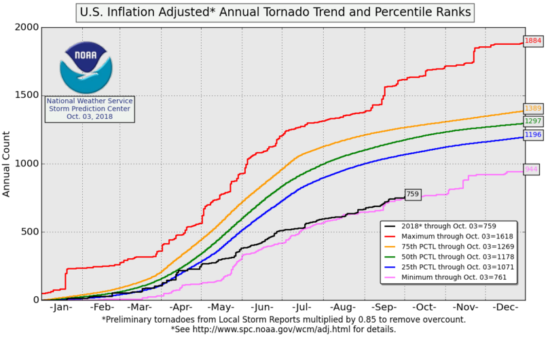

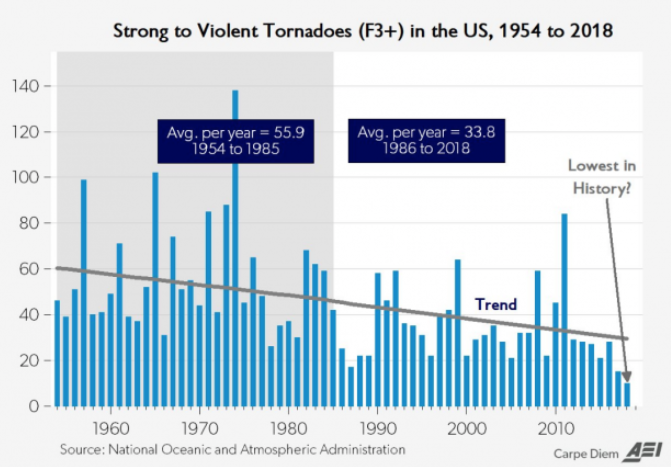
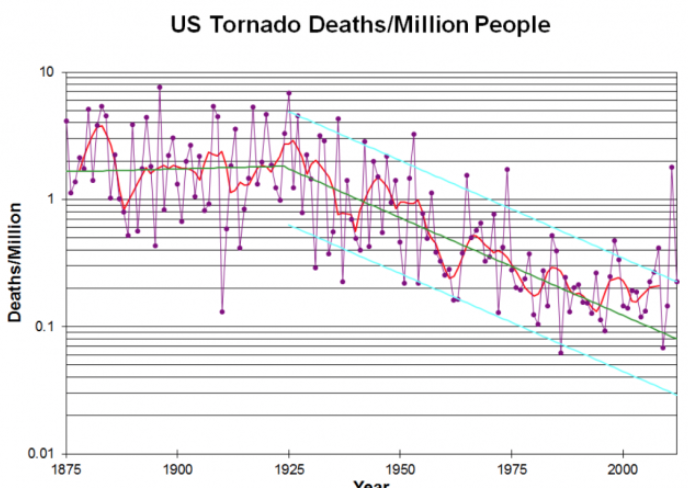
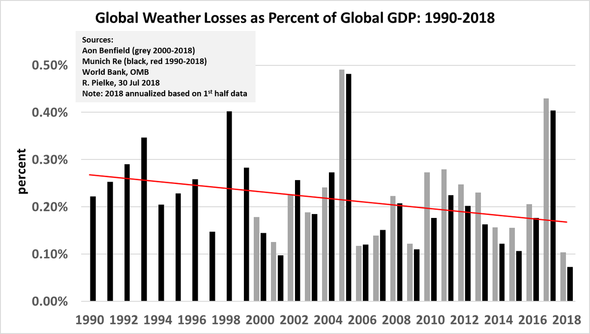
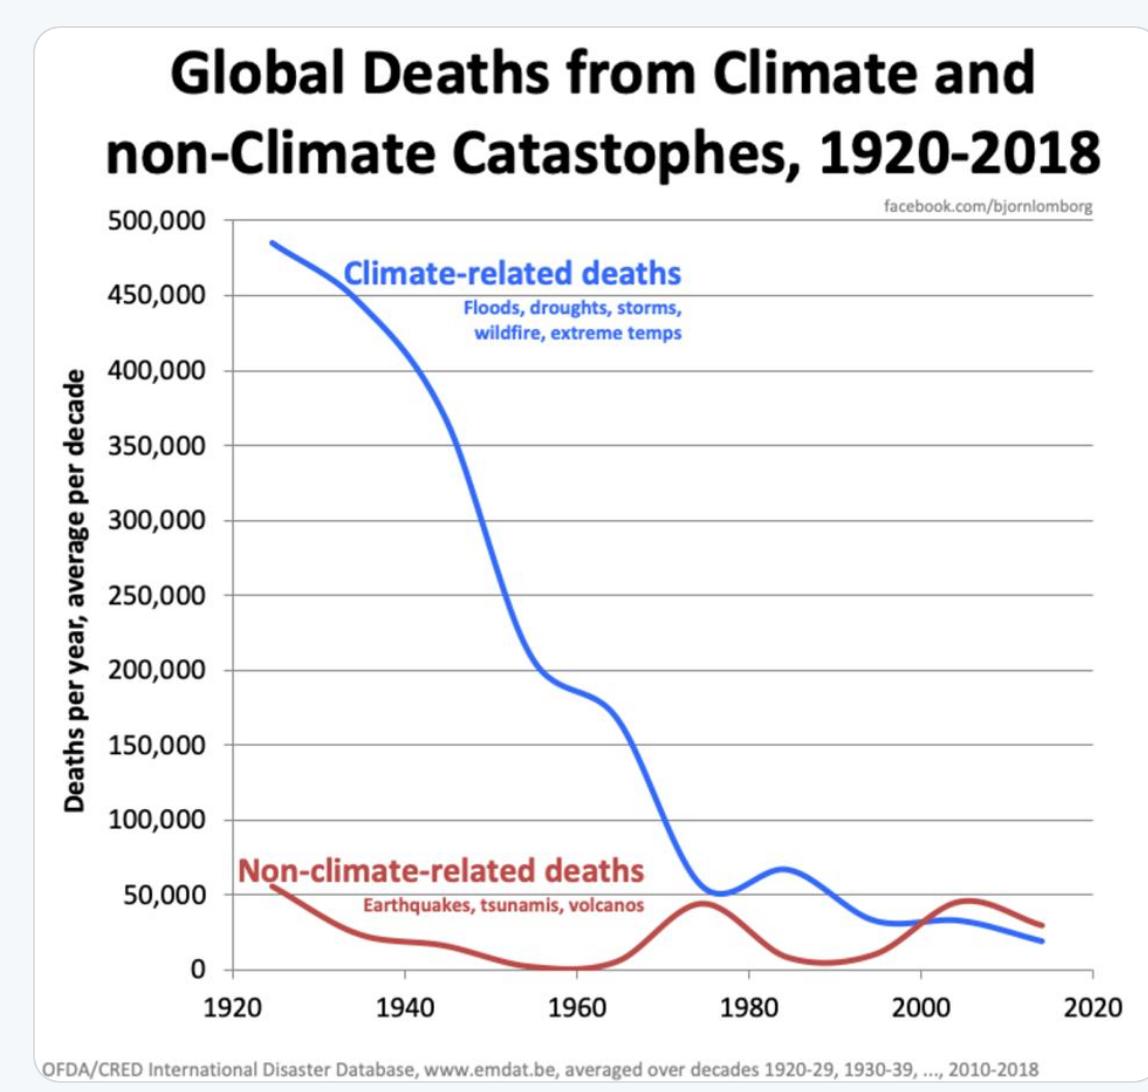
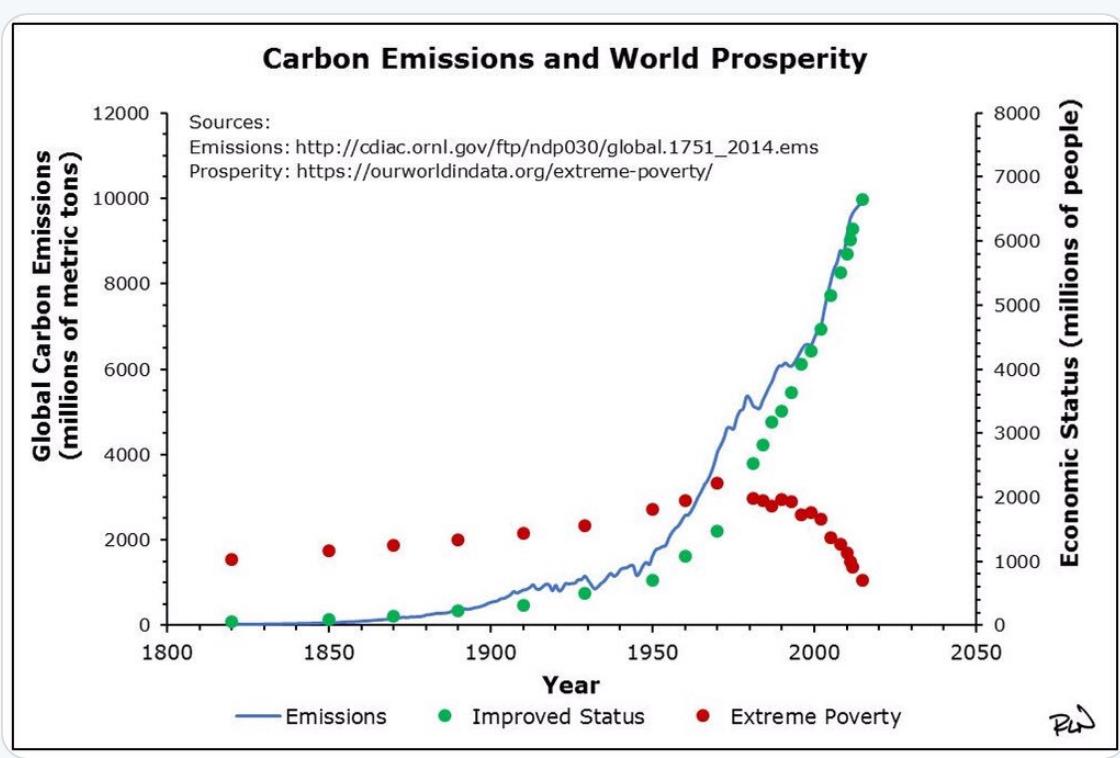


Recent Comments