NASA’s MSU satellite measurement systems, generate the RSS and UAH datasets, which measure the average temperature of every cubic inch of the lower atmosphere (0-10 kms), which happens to be the exact place where anthropogenic global warming is meant to occur, according to anthropogenic global warming theory.
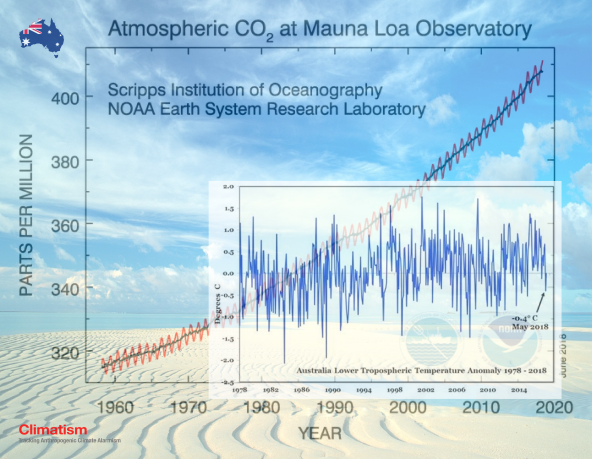
AUS MAY TEMPS -0.4C BELOW AVERAGE
UAH temperature anomaly for May was almost half a degree centigrade (-0.4C) below the 4o year average!
AUSTRALIA Lower Troposheric Temperature Anomaly 1978-2018
SATELLITES have the obvious benefit of measuring only the atmosphere and the effect that carbon dioxide emissions may be having on the atmosphere. Satellite data is not polluted by UHI (Urban Heat Island effect) – artificial heat generated from city infrastructure; asphalt carparks, airpots, highways, AC vents etc.
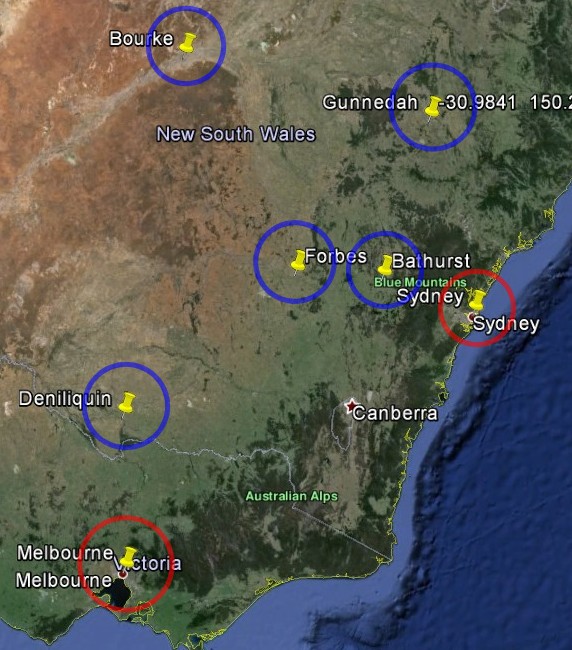
TONY Heller did a survey of the ten oldest stations in New South Wales And Victoria, circled below. Three rural stations were not included because of obvious problems with the data, but none showed any warming:
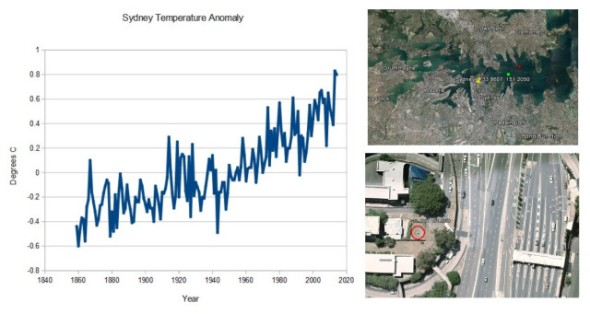
The two urban stations at Melbourne and Sydney both showed strong warming, and both have disastrously poor siting of their thermometers in the middle of large cities.
Melbourne Temperature Anomaly
Sydney Temperature Anomaly
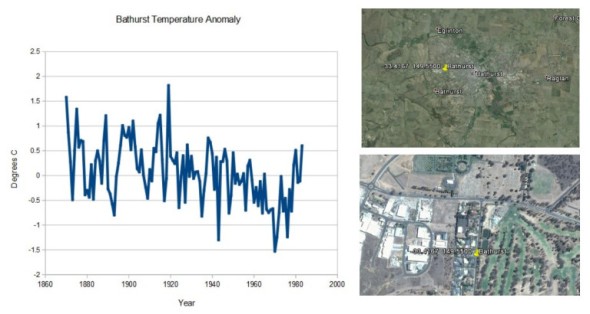
By contrast, all of the rural stations show a long term cooling trend, with some recent warming. (Note that there is no data for the most recent years with some of the rural stations.)
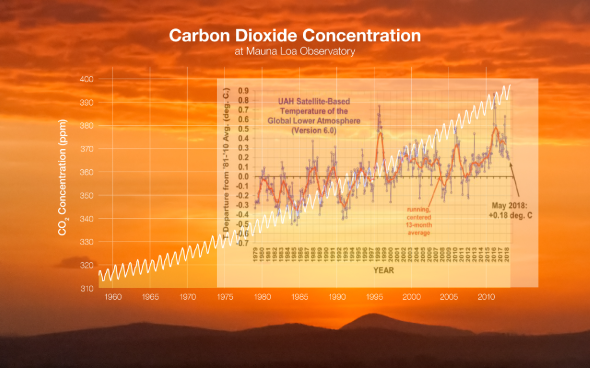
ACCORDING to NASA data, the recent 0.56°C plunge in global temperatures, following the 2015/16 super El Niño, is the greatest two-year cooling event in a century. “You have to go back to 1982-84 for the next biggest two-year drop, 0.47°C—also during the global warming era.”
NASA’s MSU satellite measurement systems, generate the RSS and UAH datasets, which measure the average temperature of every cubic inch of the lower atmosphere (0-10 kms), the exact place where global warming theory is meant to occur.
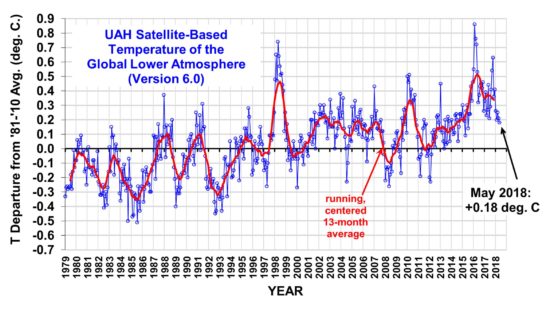
MAY TEMPS +0.18C ABOVE AVERAGE
GLOBAL temps continue their cooling trend, rebounding off the 2015/16 Super El Niño – the strongest since accurate measurements began, caused by surface waters in the Pacific Ocean, west of Central America rising up to 3C warmer than usual.
GREENHOUSE GAS THEORY CHECK?
THE latest UAH V6.0 May anomaly of +0.18 brings temperatures back to the levels they were at the beginning of the Century, reinforcing the current 18+ year global warming “pause”, despite record and rising CO2 emissions…
UAH Global Temperature Update for May, 2018- +0.18 deg. C « Roy Spencer, PhD
Latest Global Average Tropospheric Temperatures
Since 1979, NOAA satellites have been carrying instruments which measure the natural microwave thermal emissions from oxygen in the atmosphere. The intensity of the signals these microwave radiometers measure at different microwave frequencies is directly proportional to the temperature of different, deep layers of the atmosphere. Every month, John Christy and I update global temperature datasets that represent the piecing together of the temperature data from a total of fifteen instruments flying on different satellites over the years. A discussion of the latest version (6.0) of the dataset is located here.
The graph above represents the latest update; updates are usually made within the first week of every month. Contrary to some reports, the satellite measurements are not calibrated in any way with the global surface-based thermometer records of temperature. They instead use their own on-board precision redundant platinum resistance thermometers (PRTs) calibrated to a laboratory reference standard before launch.
GLOBAL TEMPERATURE MEASUREMENTS – JUDGE FOR YOURSELF!
Satellites Vs Thermometers?
*
SATELLITES
NASA’s MSU satellite measurement systems, generate the RSS and UAH datasets, which measure the average temperature of every cubic inch of the lower atmosphere, the exact place where global warming theory is meant to occur. Read the rest of this entry »
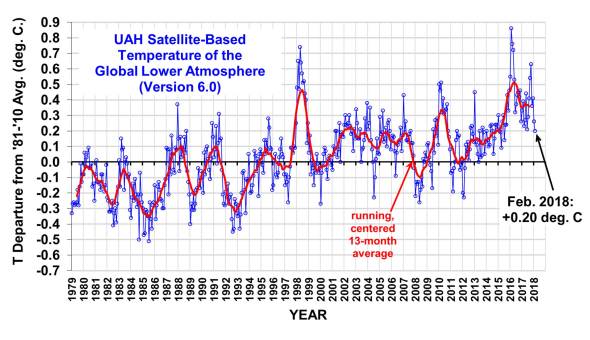
GLOBAL temps continue their cooling trend, rebounding off the 2015/16 Super El Niño – the strongest since accurate measurements began, caused by surface waters in the Pacific Ocean, west of Central America rising up to 3C warmer than usual.
THE latest UAH V6.0 February anomaly of +0.20 brings temperatures back to the levels they were at after the 1998 El Niño.
The Version 6.0 global average lower tropospheric temperature (LT) anomaly for January, 2018 was +0.26 deg. C, down from the December, 2017 value of +0.41 deg. C:
Global area-averaged lower tropospheric temperature anomalies (departures from 30-year calendar monthly means, 1981-2010). The 13-month centered average is meant to give an indication of the lower frequency variations in the data; the choice of 13 months is somewhat arbitrary… an odd number of months allows centered plotting on months with no time lag between the two plotted time series. The inclusion of two of the same calendar months on the ends of the 13 month averaging period causes no issues with interpretation because the seasonal temperature cycle has been removed as has the distinction between calendar months.
WITHOUT a shadow of a doubt, the greatest scientific hoax ever perpetrated against mankind is that human’s modern life (including your sandwich) is causing catastrophic “climate change” or “global warming” or “climate disruption” or “climate breakdown”, depending on the day and the activist concerned.
Global effects of El Niño event seem to have passed, and we’ve cooled to a value just before the event, according to data from the UK Hadley Climate Centre
Earlier we reported on ocean temperatures dropping, now we have confirmation that global air temperature is dropping as well. The latest data is in, and now according to HadCRUT data, we are back to the same level as before the 2014/2016 super El Niño event heated up the planet.
The HadCRUT4.5 temperature anomaly for September calculated by spherical triangulation is 0.54C, a fall of 0.17C since August. Temperatures have seemingly returned to a long trend after the 2016 El Niño.
Monthly temperature anomalies for HadCRUT4.5 (HadSST3 and CRUTEM4.6 stations data) calculated by spherical triangulation method. Click for a larger image
FOLLOWING on from the landmark paper by warmist scientists in Nature Geosciencethat concedes the world has not warmed as predicted this century, comes a new paper from Scafetta et al, confirming that the global warming “pause” or “hiatus” indeed lives on!
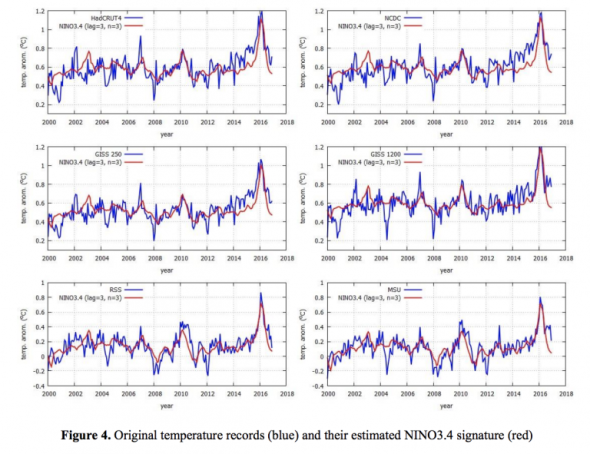
The period from 2000 to 2016 shows a modest warming trend that the advocates of the anthropogenic global warming theory have labeled as the “pause” or “hiatus.” These labels were chosen to indicate that the observed temperature standstill period results from an unforced internal fluctuation of the climate (e.g. by heat uptake of the deep ocean) that the computer climate models are claimed to occasionally reproduce without contradicting the anthropogenic global warming theory (AGWT) paradigm. In part 1 of this work, it was shown that the statistical analysis rejects such labels with a 95% confidence because the standstill period has lasted more than the 15 year period limit provided by the AGWT advocates themselves. Anyhow, the strong warming peak observed in 2015-2016, the “hottest year on record,” gave the impression that the temperature standstill stopped in 2014. Herein, the authors show that such a temperature peak is unrelated to anthropogenic forcing: it simply emerged from the natural fast fluctuations of the climate associated to the El Niño–Southern Oscillation (ENSO) phenomenon. By removing the ENSO signature, the authors show that the temperature trend from 2000 to 2016 clearly diverges from the general circulation model (GCM) simulations. Thus, the GCMs models used to support the AGWT are very likely flawed. By contrast, the semi-empirical climate models proposed in 2011 and 2013 by Scafetta, which are based on a specific set of natural climatic oscillations believed to be astronomically induced plus a significantly reduced anthropogenic contribution, agree far better with the latest observations.
1. INTRODUCTION
As explained in part 1 of this study [1], in the last decade future climate scenarios have been used to develop and politically enforce energy expensive policies to contrast catastrophic climate warming expectations for the 21st century. This has been done mostly by the United Nations Intergovernmental Panel on Climate Change [2, 3, 4]. Several studies based on general circulation model (GCM) simulations of the Earth’s climate concluded that the 20th century climate warming and its future development depend almost completely on anthropogenic activities. Humans have been responsible of emitting in the atmosphere large amount of greenhouse gases (GHG) such as CO2 throughout the combustion of fossil fuels. This paradigm is known as the Anthropogenic Global Warming Theory (AGWT).
However, before trusting GCM projections about future climatic changes, it is necessary to validate these models by testing whether they are able to properly reconstruct past climate changes. In Ref. [1], the authors have argued that since 2001 AGWT was actually supported by the belief that the “hockey stick” proxy temperature reconstructions, which claim that an unprecedented warming occurred since 1900 in the Northern Hemisphere, were reliable [2,5] and could be considered an indirect validation of the available climate models supporting the AGWT [6]. However, since 2005 novel proxy temperature reconstructions questioned the reliability of such hockey stick trends by demonstrating the existence of a large millennial climatic oscillation [7-10]. This natural climatic variability is confirmed by historical inferences [11] and by climate proxy reconstructions spanning the entire Holocene [12, 13]. A millennial climatic oscillation would suggest that a significant percentage of the warming observed since 1850 could simply be a recovery from the Little Ice Age of the 14th – 18th centuries and that throughout the 20th century the climate naturally returned to a warm phase as it happened during the Roman and the Medieval warm periods [9, 11, 14- 16].
To test the reliability of the Coupled Model Intercomparison Project Phase 5 (CMIP5) GCMs, in Ref. [1] it was shown that for the period 1860-2016 they predict an excessive warming relative to four independent global surface temperature reconstructions. This was a first significant discrepancy between observations and models. Then, it was noted that AGWT advocates had claimed that discrepancies between observation and modeled predictions could occur because of an unforced internal variability of the climate system that the same GCMs are able to predict [17].
These people were very explicit by providing the following scientific criterion to validate the models: “The simulations rule out (at the 95% level) zero trends for intervals of 15 year or more, suggesting that an observed absence of warming of this duration is needed to create a discrepancy with the expected present-day warming rate” [18].
By using such a 15-year interval criterion, in Ref. [1] we tested the CMIP5 GCMs against the observations in the periods 1922-1941, 1980-1999 and 200-2016. The first two periods were selected because they are characterized by a strong and compatible warming rate but by very different rate of anthropogenic GHG emissions. On the contrary, the 2000- 2017 period is characterized by a very strong increase of anthropogenic GHG emissions while the temperature has been quasi stationary. Our statistical analysis [1] confirmed with a 95% confidence that the GCMs fail to properly reconstruct the temperature trends in 1922-1941 and in 2000-2017. Thus, according to the very criterion proposed by the AGWT advocates themselves, the GCMs used to support the AGWT are demonstrated to be flawed.
Herein, a detailed study of the natural climatic variability observed after 2000 in six available global temperature records versus the performance of the GCMs is carried out. We also critically analyze the year 2015-2016, which has been famed as the hottest year on record. We show that this anomaly is simply due to a strong El-Niño event that has induced a sudden increase of the global surface temperature by 0.6 oC. This event is unrelated to anthropogenic emissions. In fact, an even stronger El-Niño event occurred in 1878 when the sudden increase of the global surface temperature was 0.8 oC: see Figure 2 in Ref. [1]. Finally, for the post 2000 period we compare the predictions of the CMIP5 GCMs used by the IPCC [2013], against that of two semi-empirical models proposed a few years ago [15,19].
These models were based on a specific number of natural oscillations suggested by astronomical considerations plus an anthropogenic warming effect strongly reduced by 50% relative to the GCM predictions. We stress that the latter result is consistent with recent scientific literature findings [20] confirming that the real climate sensitivity to CO2 doubling is about half, that is between 1 oC and 2 oC, than what predicted by the GCMs supporting the AGWT, which is about 3 oC [4].
Warmist paper Millar et al confirming the warming slowdown in the first fifteen years of this century, contradicting UN IPCC Climate model simulations :
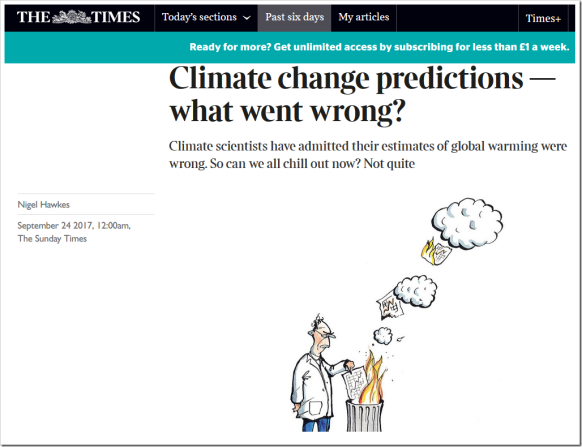
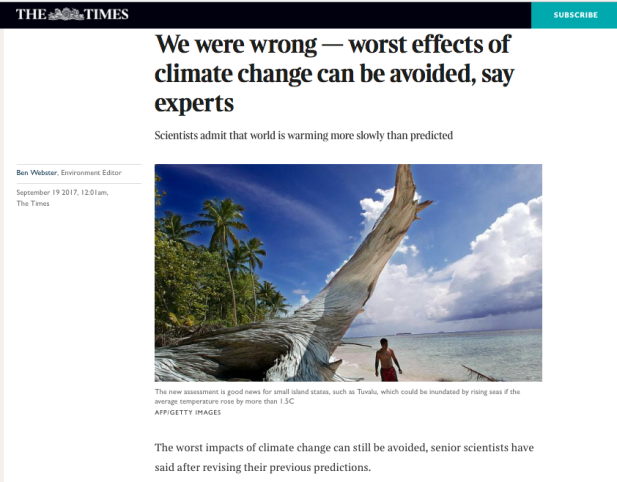
AS egg-on-face moments go, it was a double-yolker. Last week a group of climate scientists published apaper that admitted the estimates of global warming used for years to torture the world’s conscience and justify massive spending on non-carbon energy sources were, er, wrong. | THE TIMES
“The data doesn’t matter. We’re not basing our recommendations
on the data. We’re basing them on the climate models.”
– Prof. Chris Folland,
Hadley Centre for Climate Prediction and Research
“Themodels are convenient fictions
that provide something very useful.”
– Dr David Frame,
climate modeler, Oxford University
***
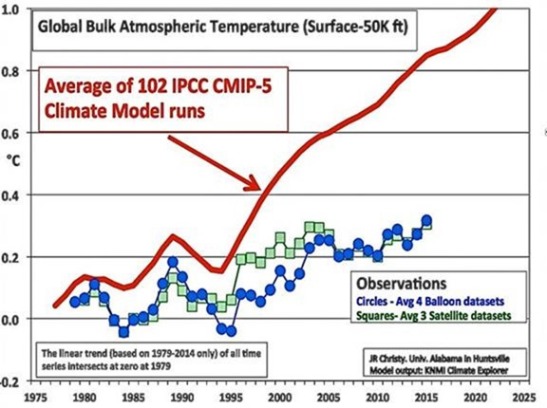
IN February 2016, climate scientist Dr. John Christy presented testimony to Congress demonstrating that the UN IPCC’s CMIP5 climate models grossly exaggerate and over estimate the impact of atmospheric CO2 levels on global temperatures. Dr. Christy noted in his testimony that “models over-warm the tropical atmosphere by a factor of approximately three″.
A landmark paper by warmist scientists in Nature Geosciencenow concedes the world has indeed not warmed as predicted, thanks to a slowdown in the first 15 years of this century. One of its authors, Michael Grubb, professor of international energy and climate change at University College London, admits his past predictions of runaway warming were too alarmist.
“When the facts change, I change my mind. We are in a better place than I thought.”
ANOTHER author, Myles Allen, professor of geosystem science at Oxford, confessed that too many of the mathematical models used by climate scientists to predict future warming “were on the hot side” — meaning they exaggerated.
“We haven’t seen that rapid acceleration in warming after 2000 that we see in the models.”
SO, the sceptics – the “climate deniers” – were spot-on, again.
The global warming backpedalling begins. “It’s less worse than we thought” | Tallbloke’s Talkshop
AND yet we have spent literally trillions of dollars of other peoples’ (taxpayers) money on alarmist global warming climate change policies, schemes and rent-seeking scams (windmills, solar panels, mothballed desal plants, pink bats, carbon taxes etc) on the advice of overheated, predictive computer models that do not even observe real-world reality!?
DON’T expect an apology or your money back anytime soon. The climate juggernaut will keep digging at your hip pocket a little while longer – too much money is on the line and too many reputations are now at stake.
There has been a desperate attempt to divert attention away from the findings of the new paper. This article mentions a letter to the Times by the phoneys, Lords Krebs and Stern.
I have also seen a similar letter in the Mail from Myles Allen. It stated that the difference of 0.3C was really rather insignificant, and that we were still all going to die if we did mend our evil ways, only slightly later!
But the difference is actually really huge, bearing in mind that this is over a period of just 15 years, and particularly when the authors admit that emissions of CO2 have been much greater than originally assumed.
Contrary to popular myth, summer sea ice extent in the Arctic is not in a death spiral.
As the above DMI graph shows, August extent has been remarkably stable since 2007.
Back in March, the “experts” were telling us that the record low extent last winter would inevitably lead to lower summer extent.
For instance, Rick Thoman the climate science manager for the National Weather Service’s Alaska region told us:
“If we are starting out very low that gives a jump on the melt season. For the last few years, we have had extremely low ice cover in the summer. That means a lot more solar energy absorbed by the darker open water. That heat tends to carry over from year to year.”
MORE on the shock, global warming “pause” paper from warmists Santer, Mann et al !
via PA Pundits…
UPDATE via Climatism:
MAKE NO MISTAKE. This paper is massive. It basically reaffirms what climate sceptics (“Deniers”) have been stating for years – that despite record CO2 emissions over the past 20 years, there has been NO statistically significant global warming over this period.
There is a catastrophic problem with the UN’s billion dollar CMIP5 climate models that essentially drive the $trillion global warming industry. They are grossly overheated, leading to the panic, hysteria and fake news seen daily on the topic.
Something other than CO2 must be driving the climate. And The Godfather’s of global warming doom and gloom – Ben Santer and Mikey (hockey stick) Mann et al have released this *scientific* paper supporting the sceptical notion of a lower CO2 sensitivity than perceived by the “97%”.
It is being touted in the sceptic community as “Black Monday” owing to the release day.
Surely, this paper spells the beginning of the end for the greatest and most costly scientific fraud ever perpetrated upon mankind.
In the early twenty-first century, satellite-derived tropospheric warming trends were generally smaller than trends estimated from a large multi-model ensemble.
The problem is the models on which the global warming scare is based were simply wrong:
We conclude that model overestimation of tropospheric warming in the early twenty-first century is partly due to systematic deficiencies in some of the post-2000 external forcings used in the model simulations.


 Global area-averaged lower tropospheric temperature anomalies (departures from 30-year calendar monthly means, 1981-2010). The 13-month centered average is meant to give an indication of the lower frequency variations in the data; the choice of 13 months is somewhat arbitrary… an odd number of months allows centered plotting on months with no time lag between the two plotted time series. The inclusion of two of the same calendar months on the ends of the 13 month averaging period causes no issues with interpretation because the seasonal temperature cycle has been removed as has the distinction between calendar months.


 By Andrew Bolt ~
 From the

Recent Comments