SOME might argue that the latest global temperature, as measured by x15 NASA/NOAA AMSU (advanced microwave sounding unit) satellites, measuring literally every square inch of the lower troposphere (the exact place where ‘man-made global warming’ is supposed to occur) might be an anomaly caused by the de-industrialisation experiment carried out during draconian COVID-19 lockdowns.
Not so, according to the UN’s own meteorological agency, the WMO.
They concluded that despite the draconian COVID-19 lockdowns that initiated the greatest de-industrialisation science experiment ever carried out in human history, CO₂ levels failed to drop…
Ergo, if CO₂ concentrations didn’t budge, at all, during the most comprehensive global science experiment ever undertaken in mankind’s history, then how do we know that they are even ‘ours’ to ‘bring down’?
NOAA current data reveals that global CO₂ levels are higher now, not lower, than at the same period in 2020.
So, if CO₂ levels are naturally increasing, then why is the global atmospheric temperature, according to NASA’s own MSU satellites, now below the 40 year average?
LATEST NASA/NOAA SATELLITE, GLOBAL TEMPERATURE ANOMALY
UAH Global Temperature Update for March 2021: -0.01 deg. C « Roy Spencer, PhD
April 2nd, 2021 by Roy W. Spencer, Ph. D.
The Version 6.0 global average lower tropospheric temperature (LT) anomaly for March, 2021 was -0.01 deg. C, down substantially from the February, 2021 value of +0.20 deg. C.
REMINDER: We have changed the 30-year averaging period from which we compute anomalies to 1991-2020, from the old period 1981-2010. This change does not affect the temperature trends.
Right on time, the maximum impact from the current La Nina is finally being felt on global tropospheric temperatures. The global average oceanic tropospheric temperature anomaly is -0.07 deg. C, the lowest since November 2013. The tropical (20N-20S) departure from average (-0.29 deg. C) is the coolest since June of 2012. Australia is the coolest (-0.79 deg. C) since August 2014. The linear warming trend since January, 1979 remains at +0.14 C/decade (+0.12 C/decade over the global-averaged oceans, and +0.18 C/decade over global-averaged land). UAH Global Temperature Update for March 2021: -0.01 deg. C « Roy Spencer, PhD
After decades of alarmism about global warming frying the planet, the latest UAH satellite measures show warming of 0.01 [below] the average at the end of last century. No warming at all. And nothing that could cause all the catastrophes that have been claimed. You’ve heard this news on the ABC, right? No?
•
Background on AMSU (UAH/RSS data) satellites:
NASA/NOAA AMSU ATMOSPHERIC SATELLITES
NASA’s 15 MSU and AMSU satellites generate the RSS and UAH datasets, which measure the average temperature of every cubic inch of the lower troposphere, the exact place where global warming climate change theory is meant to occur.
UAH (University Alabama Huntsville) satellite data set run byDr. John R. Christy – Distinguished Professor of Atmospheric Science and Director of the Earth System Science Center at The University of Alabama in Huntsville, and Roy Spencer Ph.D. – Principal Research Scientist at UAH.
IN case you hadn’t noticed, the COVID19 crisis has been highly successful in drowning out the mainstream media’s go-to-weapon of mass fear and panic – ClimateChange™️.
PERHAPS the timing is fortunate as recent and prominent climate data hasn’t really held up as ammunition-worthy material in support of their “climate emergency” nightly narrative, or whatever the latest GretaThunberg™️ meme of the day requires.
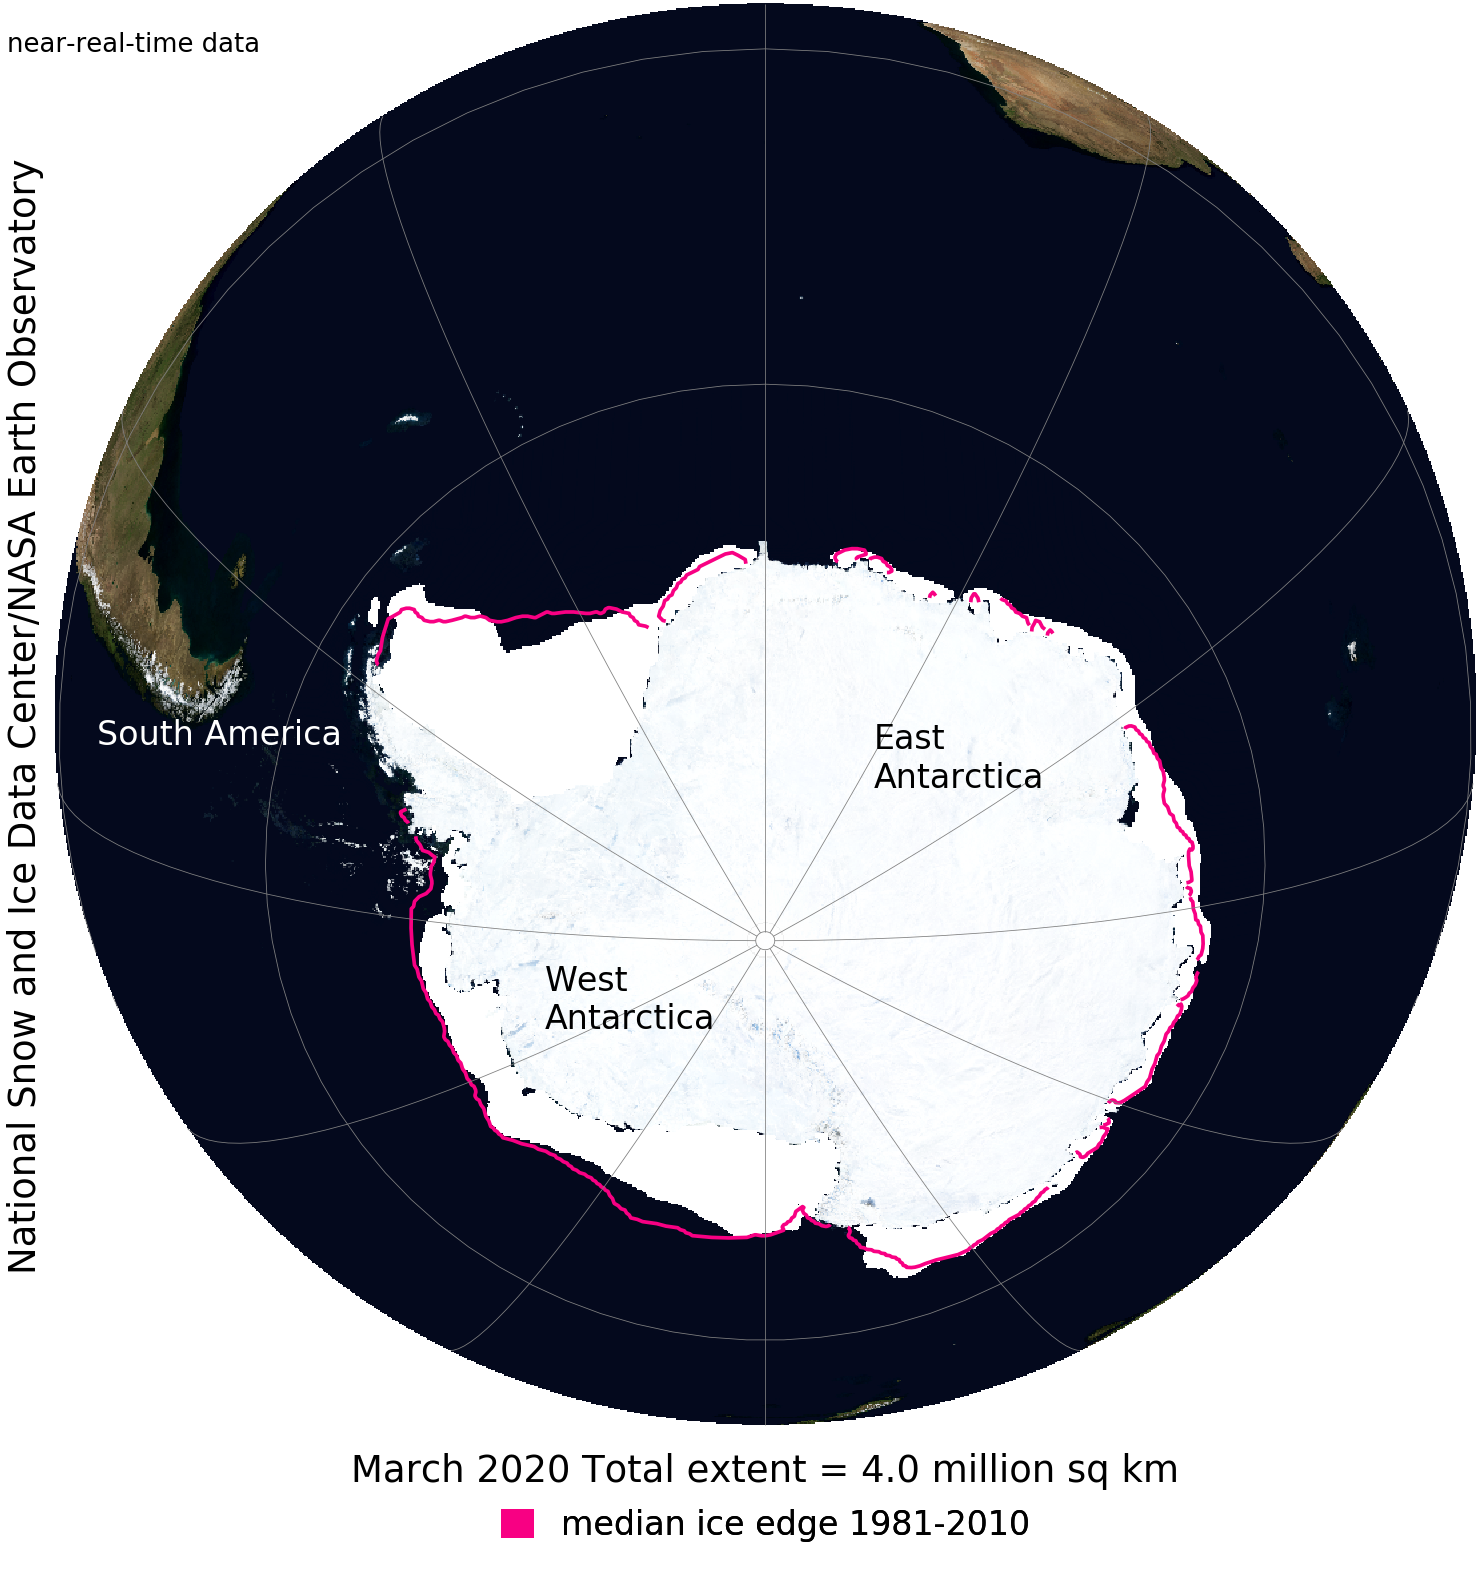
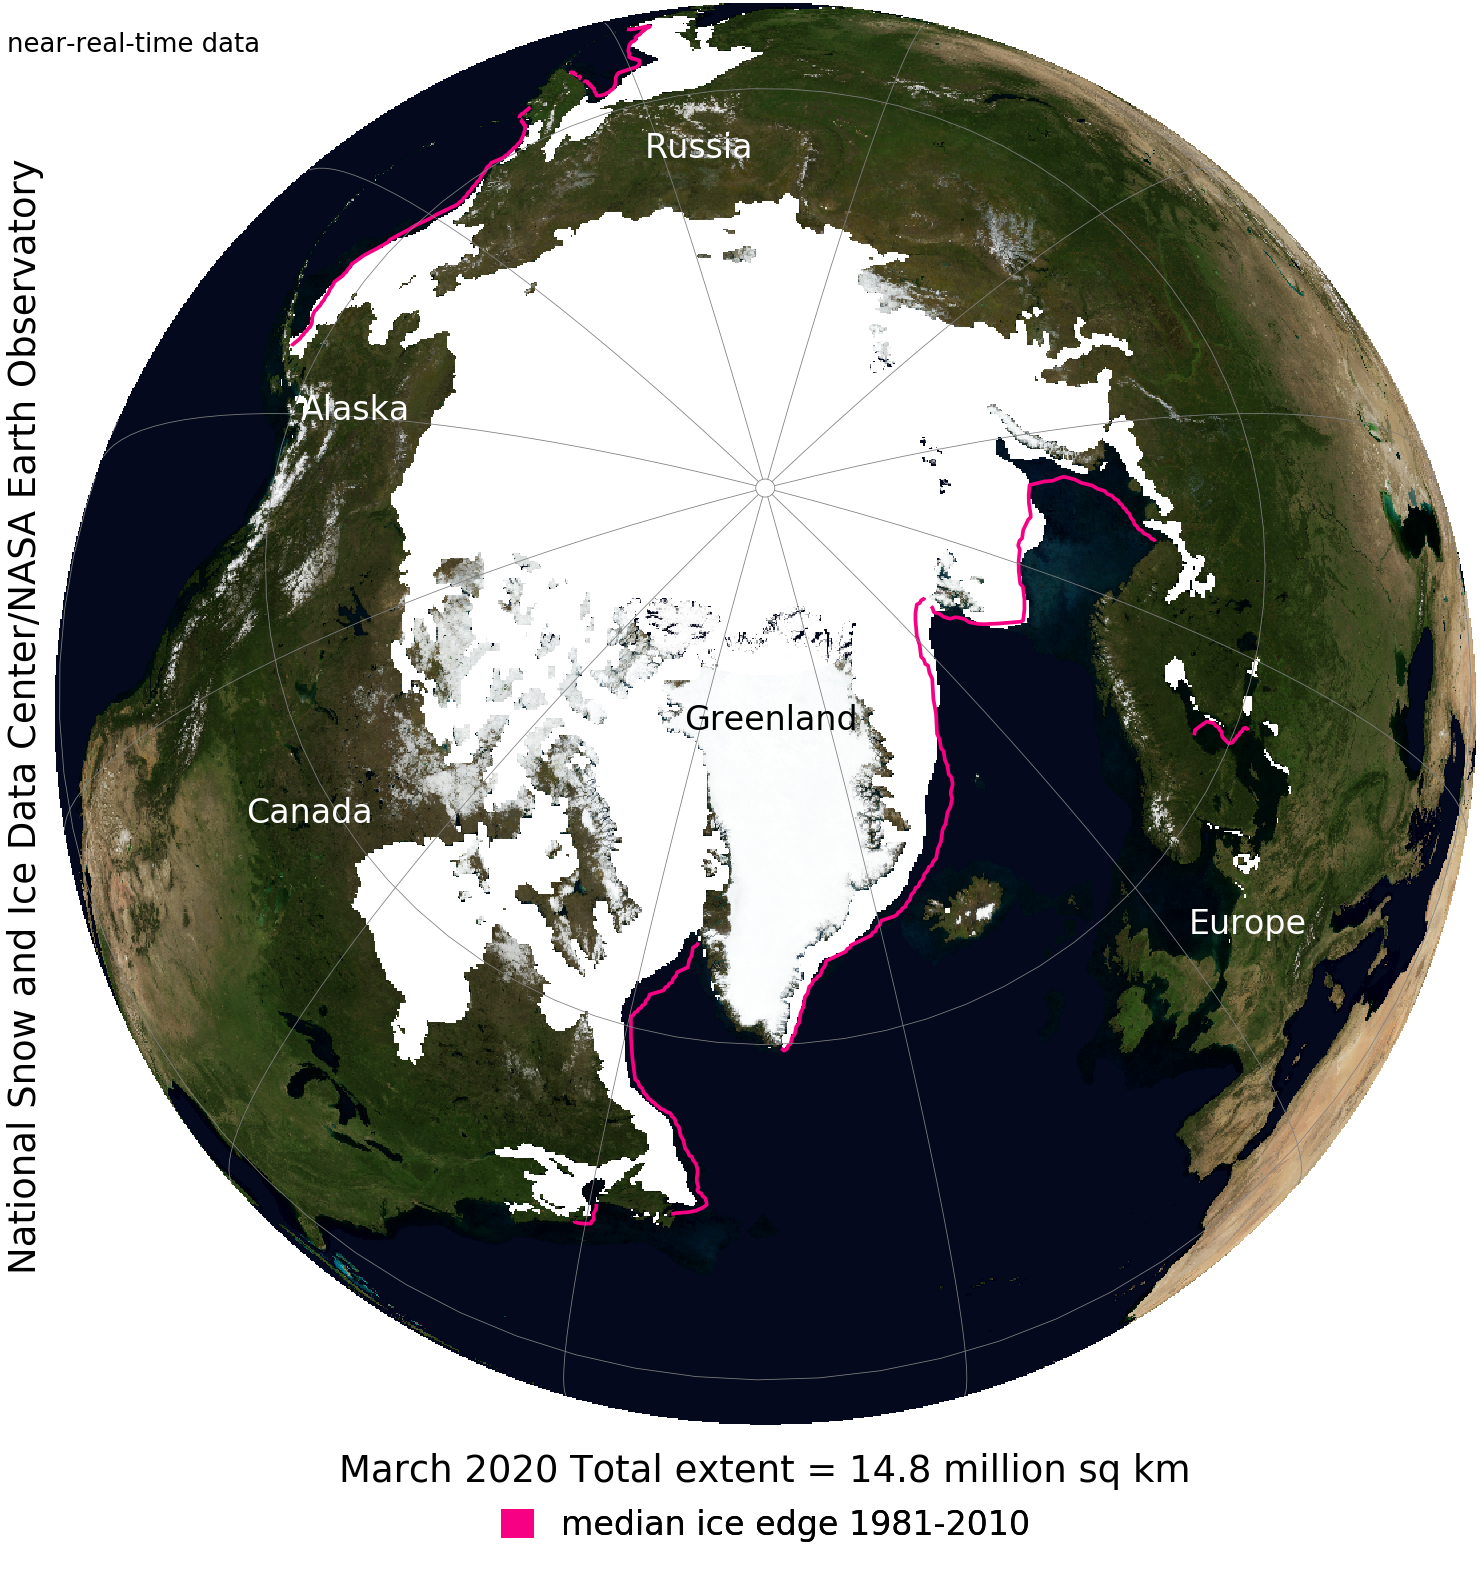
TWO of the favoured metrics used by CC activists and sycophant mainstream media, in order to push their memes, are conditions applicable to the Arctic and Antarctica. Namely, sea-ice levels.
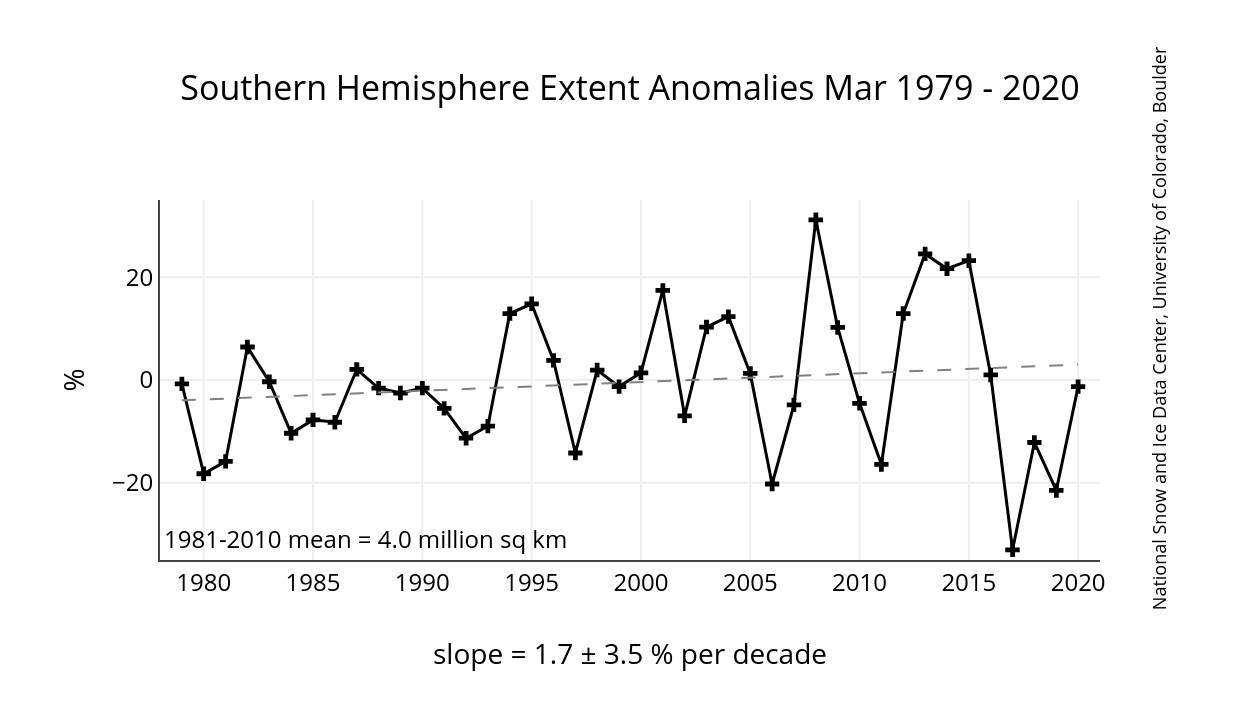
UNFORTUNATELY for climate ambulance chasers, sea-ice levels for the Arctic and Antarctica are tapping and well within the long-term average respectively. Completely at odds with ‘expert’ and mainstream media predictions and U.N. climate model forecasts.
*
ANTARCTIC SEA-ICE
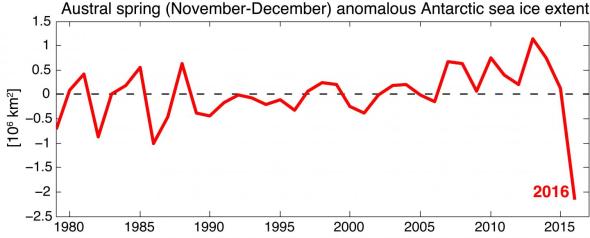
ACCORDING to NOAA, Antarctic sea-ice coverage in March came in “near the 1981–2010 avg & ended a 41-month period of below-avg monthly values.”
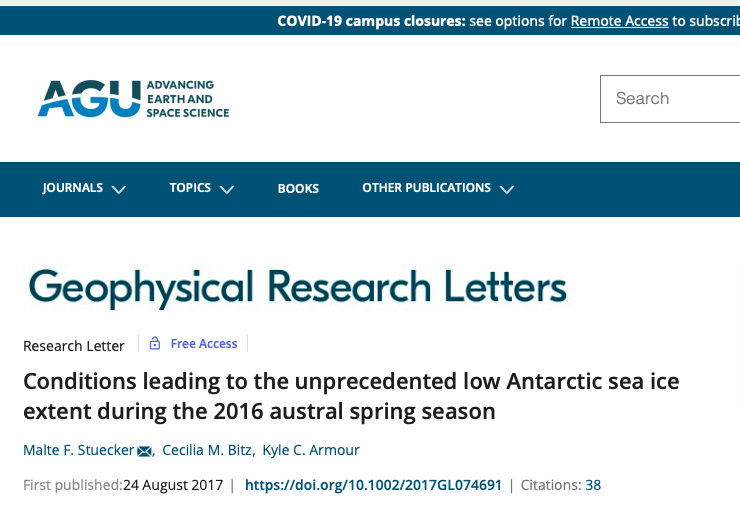
THIS rebound time (41 months) matches nicely the time from the date when a significant portion of Antarctic sea-ice was blasted away by a “perfect storm of tropical, polar conditions not due to climate change” – Malte F. Stuecker et al
ANTARCTICA has always been a thorn in the side of ClimateChange™️. It is very much the ‘inconvenient’ pole, the naughty child, that has been gaining ice mass and cooling for decades, despite a 20 per cent increase in atmospheric CO2, and model predictions to the contrary.
THE Arctic, however, has been the veritable whipping-boy for the climate activist movement, as it has seen clear declines in sea-ice levels since the century-maximum of 1979.
BUT, hardly the declines that the mainstream media and ‘experts’ made us believe to be true, according to their dire and hyper-alarmist predictions.
HERE is a taste of what the fake news media and ‘expert’s’ told you about Arctic sea-ice having “disappeared” years ago …
“Arctic summers ice-free by 2013” (BBC 2007)
“Could all Arctic ice be gone by 2012?” (AP 2007)
“Arctic Sea Ice Gone in Summer Within Five Years?”(National Geographic 2007)
“Imagine yourself in a world five years from now, where there is no more ice over the Arctic” – Tim Flannery (2008)
“North Pole could be ice-free in 2008” – Mark Serreze (New Scientist 2008)
“Gore: Polar ice cap may disappear by summer 2014” (USA Today 2009)
“Arctic expert predicts final collapse of sea ice within 4 years” (Guardian 2012)
“Say Goodbye to Arctic Summer Ice” (Live Science 2013)
“Ice-free Arctic in two years heralds methane catastrophe – scientist” (The Guardian 2013)
“Why Arctic sea ice will vanish in 2013” (Sierra Club 2013)
“Next year or the year after, the Arctic will be free of ice’” – Peter Wadhams (The Guardian 2016)
“Those who can make you believe absurdities, can make you commit atrocities.”
– Voltaire
“Blind trust in authority is the greatest enemy of the truth.”
– Albert Einstein
***
THE $2,000,000,000,000 US per year (2 Trillion)Climate Crisis Industry is not unlike the Washington “swamp”. When its orthodoxy and authority is threatened, questioned or challenged, major stakeholders launch a swift and coordinated defence to maintain the status quo.
ANY real-world evidence that contradicts the anthropogenic global warming theory (AGW) is viciously refuted with eye-popping examples of reverse logic and shameless shifting of goal-posts. However implausible, a clear and consistent message will follow nonetheless, carefully coordinated and synced between ‘scientific’ bodies and compliant mainstream media to add plausibility, authenticity and believability.
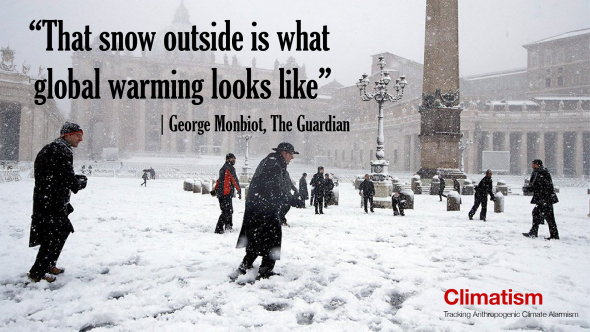
A priceless example was one by The Guardian’s resident climate catastrophist, George Monbiot, who claimed that the widespread and prolonged snowfalls of the 2017/18 Northern Hemisphere winter were caused by, yep, ‘global warming’!
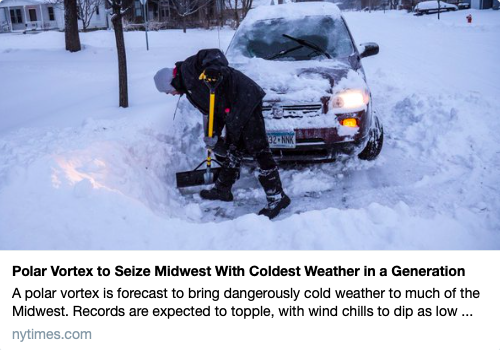
FAST forward only 10 months and the climate cult has been in crisis management mode dealing with the current Polar Vortex that has ravaged the US and Europe with historic low temperatures.
WITH the mercury in Milwaukee plunging as low as -65°F (wind chill) and Indianapolis -40°F, comparisons have been made to temperatures as cold as Mt Everest, Siberia and Mars!
Sol 2302 (2019-01-27), high -7C/19F, low -73C/-99F, pressure at 8.15 hPa, daylight 06:47-18:54 pic.twitter.com/UGTRSsulhx
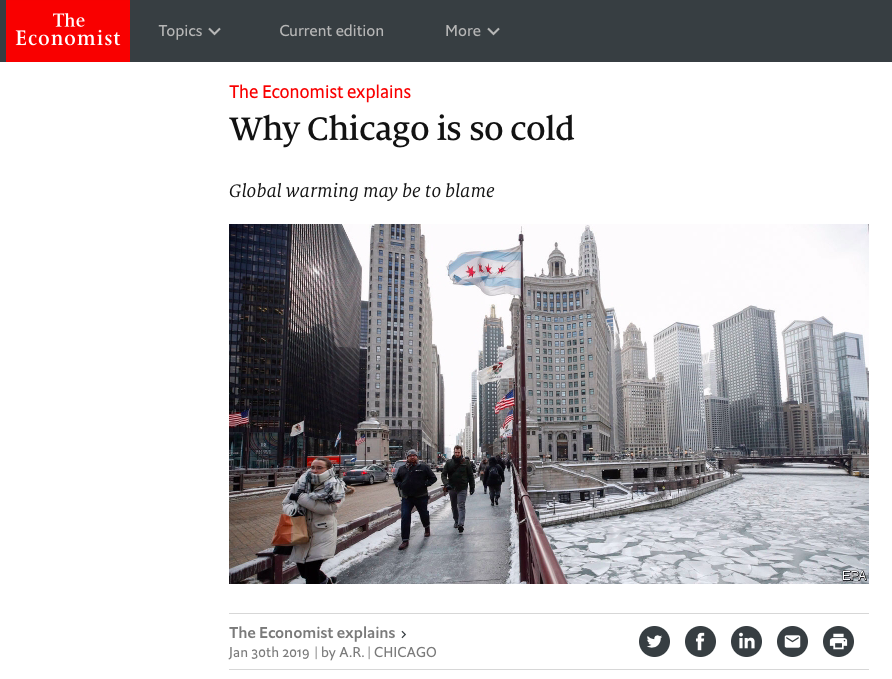
CHICAGO hit -25°F (actual) which was -2°F shy of the all time record cold set in 1985. Temperatures fell early Wednesday to -19°F making it the coldest Jan. 30 in Chicago on record. It beat the last record daily low of -15°F set on Jan. 30, 1966, according to the National Weather Service.
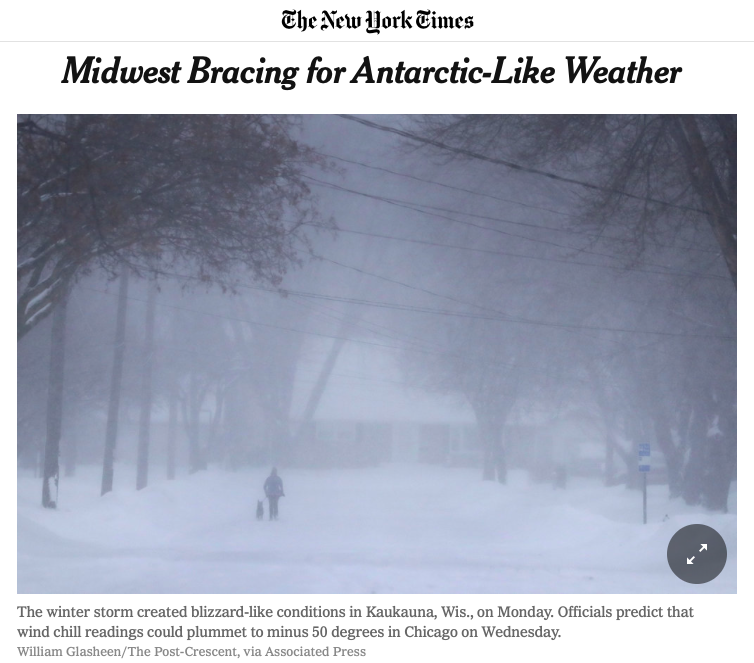
THE New York Times dubbed this years Arctic blast the “coldest weather in a generation”:
CHICAGO — Two of the most dreaded words in a Midwestern weather forecast — “polar vortex” — returned this week, promising life-threatening low temperatures that could shatter records and plunge much of the region into its deepest freeze in decades.
——-
“The vortex, a brutal mass of cold air within strong bands of circulating winds, has spread southward from its normal location near the North Pole in recent weeks, bringing arctic weather to the middle of the United States. Such weather events have become more common in recent years; scientists are not sure why, but some suspect a link to climate change.”
NOTE the Times’ urgency to blame “climate change”, even as “scientistsare not sure why”.
*
TRUMP TROLLS THE WARMISTS
NO politician or President has ever been able to unnerve the mainstream media and expose their true colours and extreme Leftist/Socialist ideologies like Trump. Like or loath him, he dares to question orthodoxy and the preferred wisdom of the day, disrupting the status quo.
HIS tweet on the extreme cold weather sent the global warming theory-obsessed mainstream media into a literal meltdown:
In the beautiful Midwest, windchill temperatures are reaching minus 60 degrees, the coldest ever recorded. In coming days, expected to get even colder. People can’t last outside even for minutes. What the hell is going on with Global Waming? Please come back fast, we need you!
TONY HELLER (Steve Goddard) quick to correct the warmist NOAA’s flawed, reactionary argument:
This is complete nonsense. The record cold air has an extremely low dew point, meaning it contains very small amounts of moisture. It is sad that government agencies like @NOAA continue to misinform the public.
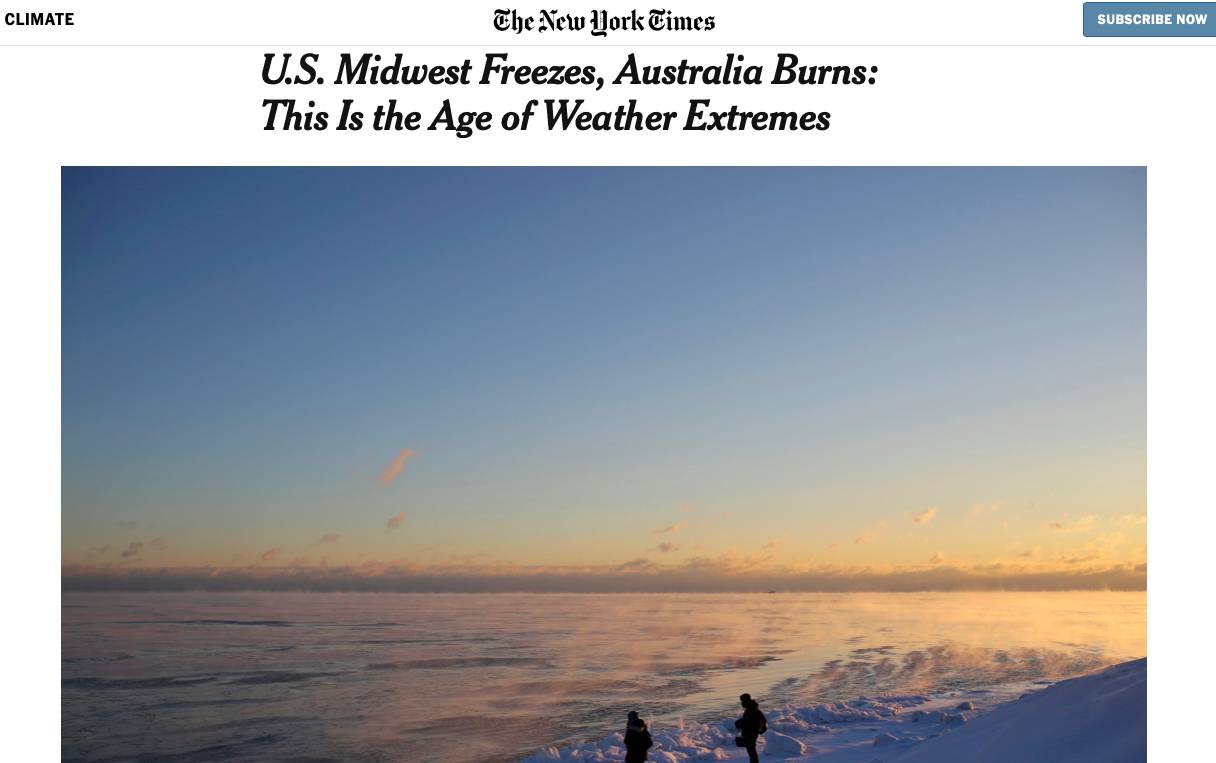
NEW YORK Times Climate – making sure you believe that both extreme cold and extreme heat are a direct byproduct of your gasses and excesses.
NOTE the goal-posts being shifted to accomodate any weather event :
Welcome to the age of extremes: In preparing for how climate change affects the weather, “we have to be prepared for a wider range of possibilities.” https://t.co/crwyGC0vnC
I noted in a past Climatism post detailing the latest IPCC report on “Extreme Weather” that the mainstream media would wilfully dismiss its ‘inconvenient’ findings:
EXTREME WEATHER, the Climate Crisis Industries favoured weapon of mass hysteria has been scuttled, once again, by their very own authority, the UN IPCC!
THE latest report finding that there is “little basis or evidence” for claiming that drought, floods, hurricanes and cyclones have increased due to greenhouse gases. Tornadoes were not even mentioned, owing to the record lack of.
BUT, alas! Just as the extreme weather findings from last IPCC report – AR5 (2013) – were conveniently dismissed by the mainstream media and climate crusaders, so too will the latest ‘inconvenient’ findings from the SR15 ‘Special Report’.
THE Grey Lady falling foul of one of the Climate Crisis Industries ten commandments – “YOU’RE CONFUSING CLIMATE WITH WEATHER”, whilst blaming CO2 – the magic molecule – for both hot and cold weather!
“Two sets of air currents determine which parts of North America and Europe get blasted by Arctic air each winter. The stratospheric polar vortex is a smallish patch of low-pressure air that circulates, anti-clockwise, in a ring some 48km (30 miles) above the Arctic. It helps to trap the coldest air near the pole and forms only in winter.
—–
The problem for America’s Midwest is that the Arctic has warmed unusually fast, a result of more greenhouse gases in the atmosphere, and so the polar jet stream is fluctuating more widely. As a result, the stratospheric polar vortex may slow down, and colder air is drawn southwards. A similar sort of shift in the air currents helped to cause the “Beast from the East” that chilled western Europe in 2018.”
*
HISTORY ‘DENIERS’
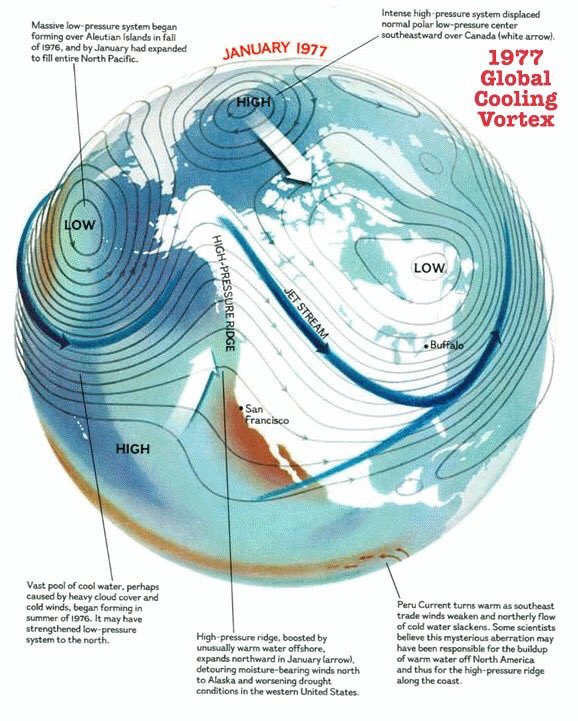
1977 “Global Cooling” Polar Vortex
*
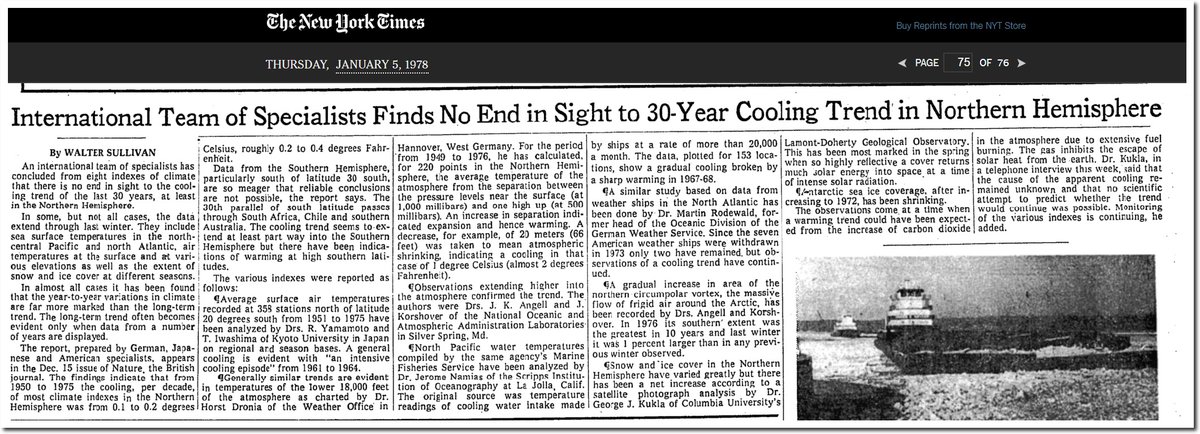
FORTY years ago, the New York Times blamed the Polar Vortex on global cooling and increasing Arctic ice. Now they say the exact opposite – the Polar Vortex is caused by global warming and decreasing Arctic ice:
“A gradual increase in area of the northern circumpolar vortex, the massive flow of frigid air around the Arctic, has been recorded by Drs. Angell and Korshover.”
*
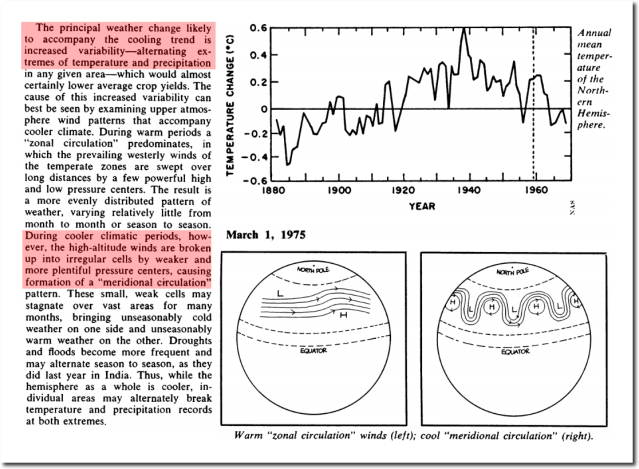
SCIENCE has known about the Polar Vortex for decades. But, as it contradicts the current ‘global warming’ theory, it’s conveniently forgotten:
Science Mag – 1975
*
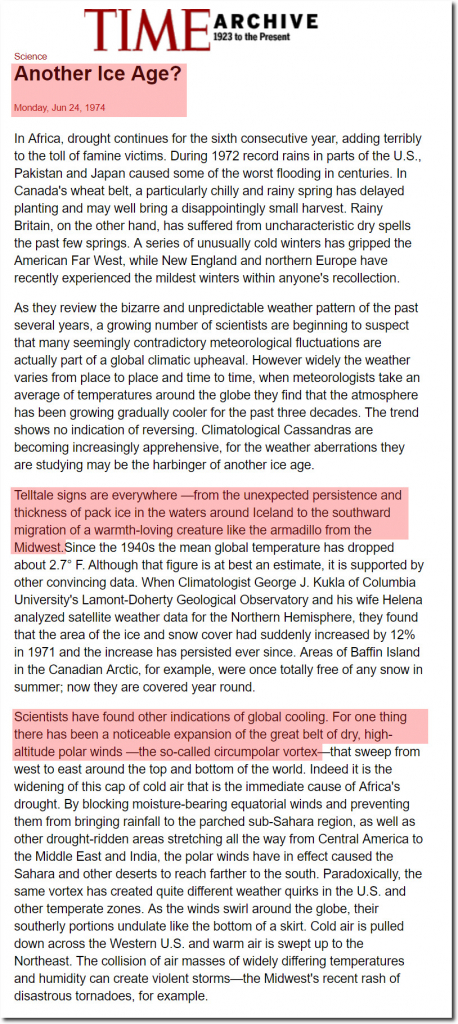
THE Polar Vortex used to be evidence of “Another Ice Age” setting in:
Another Ice Age?
Time Magazine Monday, Jun 24, 1974
Scientists have found other indications of global cooling. For one thing there has been a noticeable expansion of the great belt of dry, high-altitude polar winds —the so-called circumpolar vortex
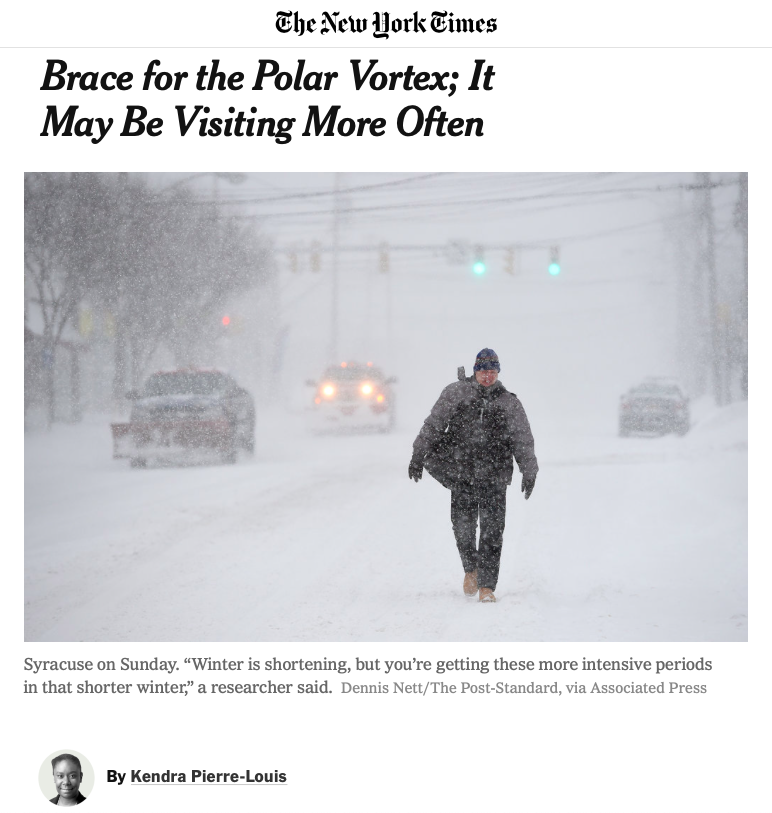
While climate change is warming the earth, not all parts of the earth are warming at the same rate; the Arctic is warming at a rate twice as fast as the world average. That warming has led to historically low levels of sea ice in the region. The melting sea ice, particularly in an area near the Barents and Kara Seas off Siberia, may be linked to the changes in the polar vortex.
“When we lose a lot of ice in that particular area in the summer, it absorbs a lot of extra heat from the sun,” Dr. Francis said. This is because the darker open ocean absorbs more heat than reflective ice. “And so we see a very persistent, hot spot there in terms of temperature differences from what they should be.”
Research suggests that the hot spot, along with changes in the jet stream driven by climate change, cause the polar vortex to break down in mid- to late winter.
(Climatism bolds)
WORKING for the New York Times, one would think Kendra would have access to historical (Polar Vortex) articles from her own workplace? Google?
MAYBE delving into the ‘inconvenient’ past simply wrecks her entire narrative. That would be a shame. Pity we had to do it here, for her.
***
CONCLUSION
JOHN NOLTE from his great piece in Breitbart on the Polar Vortex fiasco with this to aptly conclude:
Any student of history can look back and discover that all of history’s mass-murdering socialists — from Hitler to Stalin to Mao — have manufactured audacious lies and scapegoats as a means to consolidate power into a malevolent Central Authority.
Freedom is Slavery.
War is Peace.
Ignorance is Strength.
Cooling is Warming.
***
CLIMATE IS CYCLICAL
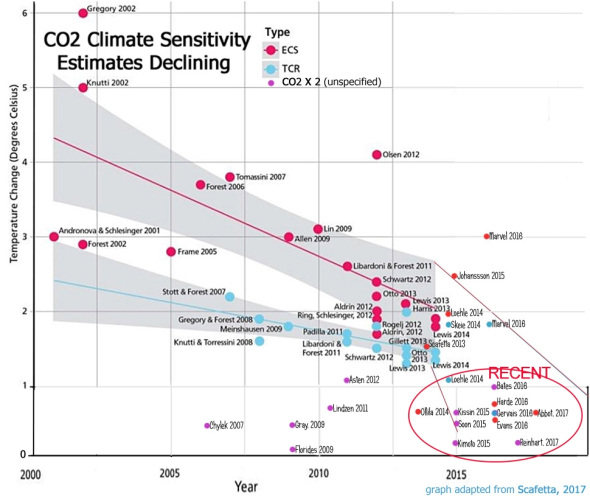
THE science as to what is the predominant driver of climate is far from “settled”. The effect to global temperature per doubling of carbon dioxide is ever-decreasing as “the science” develops. Some estimates are as low as 0.5°C by 2100.
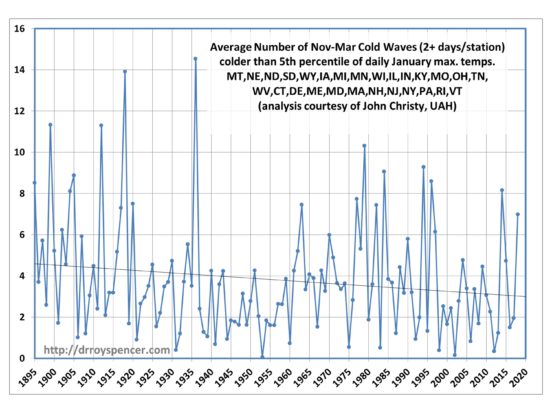
INSIGHTFUL analysis by Roy Spencer of UAH questioning the theory that declining Arctic sea-ice is the cause of the Polar-Vortex.
SPENCER provides an interesting chart from his colleague John Christy of “cold waves” in the US, showing that they are ‘declining’:
“the connection between Eastern U.S. cold waves and Arctic sea ice is speculative, at best. Just like most theories of climate change.” – Roy Spencer PhD
“At a minimum we should demand good observational support for any specific claim. In this case I would say that the connection between Eastern U.S. cold waves and Arctic sea ice is speculative, at best.
“As you know, I’m not political. If anything, I would like to see the climate change happen, so the science could be proved right, regardless of the consequences. This isn’t being political, it is being selfish.” – Phil Jones (Uni East Anglia CRU Head)
“The data doesn’t matter. We’re not basing our recommendations
on the data. We’re basing them on the climate models.”
– Prof. Chris Folland,
Hadley Centre for Climate Prediction and Research
THE “Hottest Year Ever” meme is just one in a long line of propaganda tools used by the Climate Crisis Industry to make you believe that the 1°C rise in global temperature since the end of the Little Ice Age – around 1880 – is “unprecedented” and will bring chaos to wildlife, humans and the planet.
HOW much of these claims are scientific, versus propaganda designed to heighten alarm around the agenda of catastrophic anthropogenic global warming (CAGW), is the centre of much conjecture and debate.
OF particular concern is how a handful of government climate ‘scientists’ have ‘homogenised’ the official surface-based temperature records to land us in the costly, hot mess we face today.
*
SATELLITES Vs THERMOMETERS?
*
ATMOSPHERIC SATELLITES
NASA’s 15 MSU and AMSU satellites generate the RSS and UAH datasets, which measure the average temperature of every cubic inch of the lower troposphere, the exact place where global warming climate change theory is meant to occur.
MEARS’ objectivity towards the business of global temperature data collection and reporting can be found in his commentary on his website, whilst making his global-warmist intentions clear by unleashing the groupthink pejorative “denialist” – in distasteful reference to NAZI holocaust denial…
MEARS then published a paper claiming that new and improved ‘adjustments’ had “found” that missing warming.
Mears, C., and F. Wentz, 2016: Sensitivity of satellite-derived tropospheric temperature trends to the diurnal cycle adjustment. J. Climate. doi:10.1175/JCLID- 15-0744.1, in press.
FOR the purpose of this post, we’ll look at the untampered UAH (University Alabama Huntsville) satellite data set run byDr. John R. Christy – Distinguished Professor of Atmospheric Science and Director of the Earth System Science Center at The University of Alabama in Huntsville, and Roy Spencer Ph.D. – Principal Research Scientist at UAH.
SPENCER comments on the divergence between RSS and UAH post “adjustment”:
“We have a paper in peer review with extensive satellite dataset comparisons to many balloon datasets and reanalyses. These show that RSS diverges from these and from UAH, showing more warming than the other datasets between 1990 and 2002 – a key period with two older MSU sensors both of which showed signs of spurious warming not yet addressed by RSS. I suspect the next chapter in this saga is that the remaining radiosonde datasets that still do not show substantial warming will be the next to be “adjusted” upward.
The bottom line is that we still trust our methodology. But no satellite dataset is perfect, there are uncertainties in all of the adjustments, as well as legitimate differences of opinion regarding how they should be handled.
Also, as mentioned at the outset, both RSS and UAH lower tropospheric trends are considerably below the average trends from the climate models.
GLOBAL atmospheric temperatures continue their rapid decline off the record heights of the 2015/16 super El Niño, despite record and rising CO2 emissions.
UAH global average lower tropospheric temperature (LT) anomaly for December, 2018 was +0.25°C above the 40-year average:
Our planet has just experienced the most extreme two-year cooling event in a century. But where have you seen this reported anywhere in the mainstream media?
You haven’t, even though the figures are pretty spectacular. As Aaron Brown reports hereat Real Clear Markets:
From February 2016 to February 2018 (the latest month available) global average temperatures dropped 0.56°C. You have to go back to 1982-84 for the next biggest two-year drop, 0.47°C—also during the global warming era. All the data in this essay come from GISTEMP Team, 2018: GISS Surface Temperature Analysis (GISTEMP). NASA Goddard Institute for Space Studies (dataset accessed 2018-04-11 at https://data.giss.nasa.gov/gistemp/). This is the standard source used in most journalistic reporting of global average temperatures.
The 2016-18 Big Chill was composed of two Little Chills, the biggest five month drop ever (February to June 2016) and the fourth biggest (February to June 2017). A similar event from February to June 2018 would bring global average temperatures below the 1980s average. February 2018 was colder than February 1998.
To put this temperature drop in context, consider that this is enough to offset by more than half the entirety of the global warming the planet has experienced since the end of the 19th century.
BY their own admission, the ocean data is also fake.
date: Wed Apr 15 14:29:03 2009
from: Phil Jones <p.jones@uea.ac.uk> subject: Re: Fwd: Re: contribution to RealClimate.org
to: Thomas Crowley <thomas.crowley@ed.ac.uk>
Tom,
The issue Ray alludes to is that in addition to the issue
of many more drifters providing measurements over the last
5-10 years, the measurements are coming in from places where
we didn’t have much ship data in the past. For much of the SH between 40 and 60S the normals are mostly made up as there is very little ship data there.
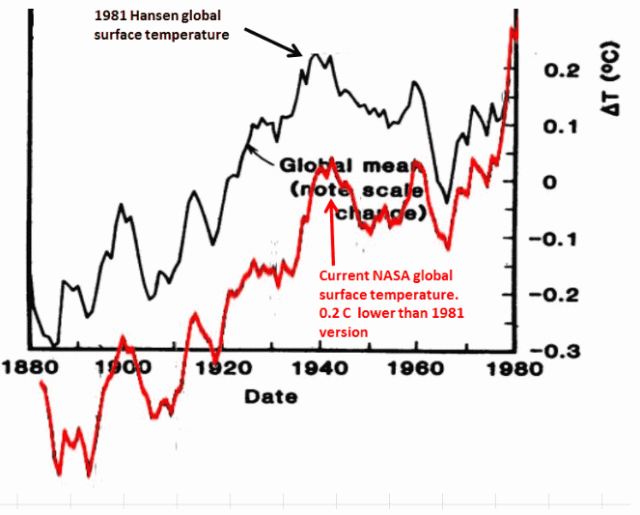
NOW it’s time to see how NASA GISS (Gavin Schmidt) and NOAA (Tom Karl) have created the ‘hockey-stick’ temperature rise over recent years in order to drive the Mann-made global warming agenda.
MIND-blowing adjustments to raw data that without exception – cool the past and warm the present – despite UHI (Urban Heat Island effect) undoubtedly compromising the latter parts of the modern temp record.
AND, if you think that the tampering of the earth’s temperature record, by cooling the past and warming the present to fit the man-made global warming narrative is another climate “denier” conspiracy theory then read this Climategate email from the UK’s leading climate expert, Phil Jones, to the UK Met Office and officials:
GLOBAL WARMING Is The Greatest And Most Successful Pseudoscientific Fraud In History | Climatism
THE problem of the 1940’s warming “blip” :
THEY did exactly what Wigley was suggesting, removing more than 0.15 C from 1940′s global temperatures. This tampering is what made the hockey stick possible.
If the present refuses to get warmer, then the past must become cooler …
NASA make up record temperatures in countries where they have no thermometer data. NOAA’s current data in Africa and much of the rest of the world is fake.
THIS enables them to make the fake “Hottest Year Ever” announcements. Memes that have more to do with PR and marketing than actual science:
THE NASA global temperature record has been massively altered over the last 20 years to cool the past and warm the present:
Steve Goddard on Twitter: “The @NASA global temperature record has been massively altered over the last 20 years to cool the past and warm the present.…”
*
NASA GISS : THE DATA SET OF CHOICE FOR THE CLIMATE THEORY OBSESSED MAINSTREAM MEDIA & POLITICAL ELITE!
IT’s not difficult to see why the NASA GISS data set is the preferred go-to for global warming activists, mainstream media, the UN IPCC and virtue-peddling politicians seeking to destroy cheap, efficient energy supply – namely coal-fired power – through the implementation of draconian climate change policy, and proposals like the U.S. Democrats’ “New Green Deal”, that if implemented will annihilate both the U.S. and the global economy and result in total control of every aspect of your life, lifestyle and any freedoms you currently enjoy.
NASA GISS’ Gavin Schmidt wants to use his junk science to control public policy, and says questions from policy makers are “tiresome” :
PRESIDENT EISENHOWER WARNED US OF THE “danger that public policy could itself become the captive of a scientific-technological elite.”
“The prospect of domination of the nation’s scholars by Federal employment, project allocations, and the power of money is ever present — and is gravely to be regarded.
Yet, in holding scientific research and discovery in respect, as we should, we must also be alert to the equal and opposite danger that public policy could itself become the captive of a scientific-technological elite.”
President Eisenhower January 17, 1961
*
CONCLUSION
FOR so long, climate ‘sceptics’ have been labeled climate/science “deniers”, in crude reference to those who deny the holocaust, with the pejorative used in a broader effort to shut down debate and silence dissent. However, when hard evidence is laid out over alarmist rhetoric, it’s not hard to see who in fact are the real deniers of history and indeed, deniers of science.
EVEN when hard data, “the science” and empirical evidence completely contradict alarmist predictions and forecasts peddled by the mainstream media and grant-driven ‘scientists’, alarmists continue to double-down on their fear-mongering instead of evaluating their theory, adhering to the “scientific method” and admitting that they might just have got it all wrong.
*
GLOBAL WARMING dogma has ruinously snowballed into a $TRILLION dollar religion to be defended at all costs by alarmist ‘scientists’, UNreliables rent-seekers and the climate theory-obsessed mainstream media in order to protect egos, jobs, reputations and access to unlimited “Save The Planet” taxpayer trillions, completely immune to oversight.
TIME to stop the rot for the sake of “science” and Western civilisation that has given us so much to be thankful for, like the dramatic drop in global poverty. Primarily due to the deployment of cheap, reliable and abundant hydrocarbon fuels. Life-giving and poverty-reducing energy sources that the zero-emissions zealots want to replace with sunshine and breezes, forcing us backwards down the energy ladder to the days of human, animal and solar power.
JUST as socialist central planning failed miserably before it was replaced by free market economies, green central planning will have to be discarded before Australia and other Western nations, crippled by the mad rush into costly and ruinous UNreliables, will see a return to energy security, competitive pricing and a ‘liveable’ existence for our most vulnerable.
LIKEWISE, climate data fraud must be called out and crushed with the scientific method restored to allay dangerous and costly climate change fear and alarmism.
“THIS could be the largest cold-stunning event to occur in Texas history.”
“The data doesn’t matter. We’re not basing our recommendations
on the data. We’re basing them on the climate models.”
– Prof. Chris Folland,
Hadley Centre for Climate Prediction and Research
“We’ve got to ride this global warming issue.
Even if the theory of global warming is wrong,
we will be doing the right thing in terms of economic and environmental policy.“
– TimothyWirth,
President of the UN Foundation
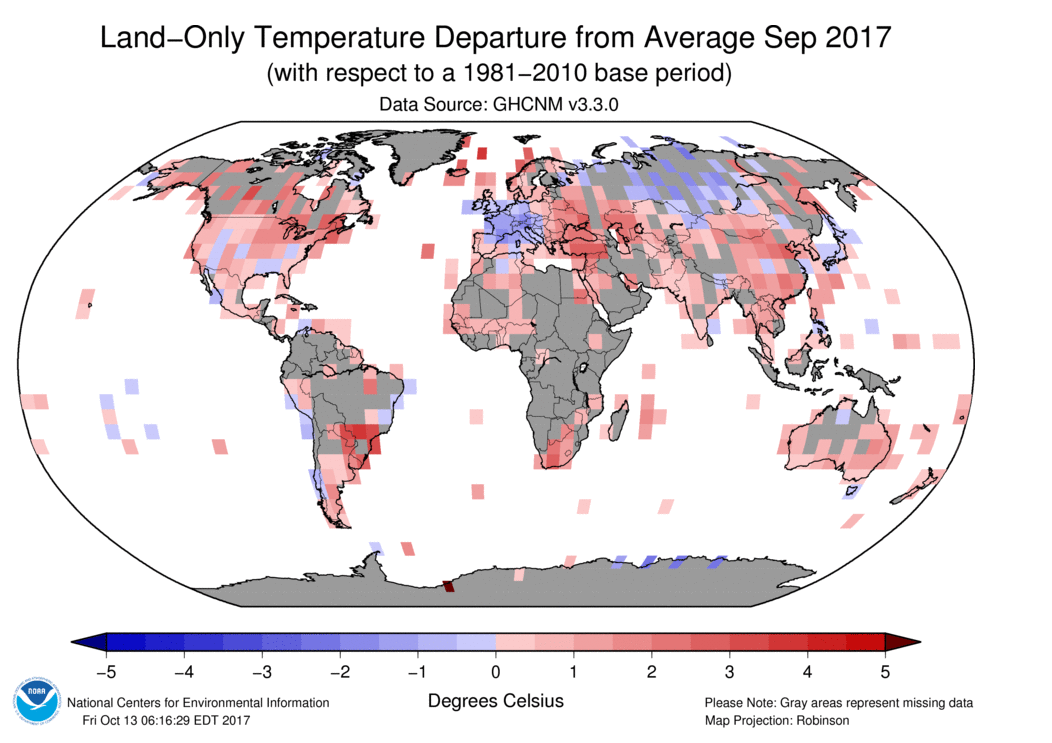
AS the natural planet shifts seasons through Fall in the Northern Hemisphere and Spring in the Southern, it’s worth looking back only 9 months ago when Earth was delivering a particularly brutal cold and snowy NH winter.
NOAA does many things well and many not so. But, ironically, one of the best things it did was to act as a warming refuge for hundreds of endangered sea turtles who would have otherwise died due to extreme cold waters off the Texas/Florida Coast.
“Experts say sea turtles that become stunned by cold weather float to the surface because they’re too cold to swim. “
“According to KHOU-TV, this could be the largest cold-stunning event to occur in Texas history.”
I know what you’re now thinking and yes, I agree: It’s hard to validate the NOAA’s persistent “HOTTEST YEAR EVAHH” findings, so gleefully published in the mainstream media, when sea-turtles are actually dying by the hundreds thanks to “THE COLDEST OCEANS EVAHH”!
A completely isolated incident, yes. But, did any UN or NOAA climate model predict “dying turtles thanks to extreme cold oceans”?
GALVESTON, Texas — Hundreds of sea turtles have been affected by cold weather in Texas. CBS News affiliate KHOU-TV reports National Oceanic and Atmospheric Administration (NOAA) workers have rescued 50 sea turtles so far.
An additional 200 are expected to arrive to the NOAA’s Galveston lab Friday, where they will be weighed, measured and later released back into the ocean.
Experts say sea turtles that become stunned by cold weather float to the surface because they’re too cold to swim.
A cold-stunned sea turtle may become “dehydrated because they’ve been floating on the surface for a few days,” Ben Higgins, sea turtle program manager, told KHOU-TV.
“We are the ones that push these animals to the brink of extinction, so we have an obligation to at least step in and help (and) try and restore their numbers,” Higgins said.
According to KHOU-TV, this could be the largest cold-stunning event to occur in Texas history.
Sea turtles, however, are not the only species that has been affected by cold weather. In Florida, it’s so cold that iguanas have been falling from their perchesin trees. Several residents have photographed the reptiles lying belly up on the ground.
But authorities say the iguanas are likely not dead. Most of them will thaw out if placed in the sun.
Anyone who may encounter a sea turtle that is in need of help should call (866) TURTLE-5 or (409) 771-2872.
A little scepticism between the agencies who control the message on “Global Warming” would not go astray in order to restore the publics faith in (once) trusted taxpayer funded institutions who used to run on science and data, not ideology, politics and grants.
•••
UPDATE 24 Nov, 2018
HUNDREDS More Frozen Turtles Since October. HuffPo blames Global Warming!
A brutal cold snap off the coast of Cape Cod in Massachusetts has led to more than 400 sea turtles freezing to death since Oct 22.
190 of the endangered Kemp’s Ridley turtles perished in just the last few of days, as a “once in a lifetime weather system” of powerful winds and freezing arctic air incapacitated the sea creatures.
The turtles were found washed ashore frozen solid on beaches in Brewster, Orleans and Eastham.
Since late October, over 400 cold-stunned turtles have been reported, according to Jennette Kerr, Communications Coordinator of the Massachusetts Audubon Society’s Wellfleet Bay Wildlife Sanctuary.
According to the Sanctuary, the first instance of turtles becoming cold stunned this season came on Oct 22.
Kerr told capecodtimes.com that she fears many more frozen turtles may wash ashore in the coming nights due to the historically low temperatures.
Sea turtles normally migrate south during the late fall and winter, but turtles being impacted by cold stuns has increased dramatically in recent years.
Kerr told the Boston Globe that there isn’t a clear reason why, but she suspected it was becoming more noticeable due to prolonged successful conservation.
I think a more likely explanation would link the deaths to the sharp drop in solar activity and the falling global average temperatures — the oceans are cooling, folks.
Prepare.
Grand Solar Minimum
I had to include this at the end, as further illustration of the stranglehold on truth the ever-more-desperate MSM hopes to maintain.
Check out HuffPost Green’s laughable explanation: The warmer ocean waters of climate change entice the turtles to linger too long too far north.
Dozens of stranded sea turtles killed by plunging temperatures at Cape Cod. https://t.co/VHe9RkaUVq
“We’ve got to ride this global warming issue.
Even if the theory of global warming is wrong,
we will be doing the right thing in terms of economic and environmental policy.“
– TimothyWirth,
Fmr President of the UN Foundation
***
GLOBAL atmospheric temperatures continue their rapid decline off the record heights of the 2016 super El Niño, despite record and rising CO2 emissions.
UAH global average lower tropospheric temperature (LT) anomaly for September, 2018 was +0.14°C, down from +0.19°C in August:
Since 1979, NOAA satellites have been carrying instruments which measure the natural microwave thermal emissions from oxygen in the atmosphere. The intensity of the signals these microwave radiometers measure at different microwave frequencies is directly proportional to the temperature of different, deep layers of the atmosphere. Every month, John Christy and I update global temperature datasets that represent the piecing together of the temperature data from a total of fifteen instruments flying on different satellites over the years. A discussion of the latest version (6.0) of the dataset is located here.
The graph above represents the latest update; updates are usually made within the first week of every month. Contrary to some reports, the satellite measurements are not calibrated in any way with the global surface-based thermometer records of temperature. They instead use their own on-board precision redundant platinum resistance thermometers (PRTs) calibrated to a laboratory reference standard before launch.
THE September anomaly represents a 0.72°C drop since 2016 super El Niño heights, bringing temps down now to ~1988 levels.
DON’T expect the mainstream media to report in this anytime soon. They are only concerned about hot and climbing temperatures to push their global warming climate change agenda.
*
CO2 CONCENTRATION Vs TEMPS – Correlation?
CO2 Vs Temp Correlation 1979 – SEP 2018 – CLIMATISM
*
GLOBAL TEMPERATURE MEASUREMENTS – You Be The Judge!
Satellites Vs Land-Based Thermometers?
Satellites Vs Thermometers?
SATELLITES
NASA’s MSU satellite measurement systems, generate the RSS and UAH datasets, which measure the average temperature of every cubic inch of the lower atmosphere, the exact place where global warming theory is meant to occur.
HOWEVER, by 2016, Carl Mears, who is the chief scientist for RSS (Remote Sensing Systems) and who has used the pejorative “denialist” in various correspondence, decided that “the pause” was not a good look for the global warming narrative so RSS was massively adjusted upwards, conveniently eliminating “the pause” in the RSS dataset.
MEARS’ objectivity towards the business of global temperature data collection and reporting can be found in his commentary on his website:
MEARS then published a paper claiming that new and improved adjustments have “found” that missing warming.
Mears, C., and F. Wentz, 2016: Sensitivity of satellite-derived tropospheric temperature trends to the diurnal cycle adjustment. J. Climate. doi:10.1175/JCLID- 15-0744.1, in press.
UAH is the satellite data set featured in this post and is jointly run byDr. John R. Christy – Distinguished Professor of Atmospheric Science and Director of the Earth System Science Center at The University of Alabama in Huntsville. And Roy Spencer Ph.D.Principal Research Scientist at the University of Alabama in Huntsville.
SPENCER commentary on the divergence between RSS and UAH post “adjustment”:
“We have a paper in peer review with extensive satellite dataset comparisons to many balloon datasets and reanalyses. These show that RSS diverges from these and from UAH, showing more warming than the other datasets between 1990 and 2002 – a key period with two older MSU sensors both of which showed signs of spurious warming not yet addressed by RSS. I suspect the next chapter in this saga is that the remaining radiosonde datasets that still do not show substantial warming will be the next to be “adjusted” upward.
The bottom line is that we still trust our methodology. But no satellite dataset is perfect, there are uncertainties in all of the adjustments, as well as legitimate differences of opinion regarding how they should be handled.
Also, as mentioned at the outset, both RSS and UAH lower tropospheric trends are considerably below the average trends from the climate models.
“And by hottest i mean Maximum Temperature. Globalists use Average Temps because minimums are skyrocketing because of UHI.”
THIS is such an underestimated, ‘inconvenient’ and non-reported fact about average global temps as well, in particular land-based GHCN/NOAA station data polluted by UHI.
INSTEAD of ‘adjusting’ out the 1-3C differences between urban and rural station data in the latter half of 20th century raw data, agencies like NASA GISS are cooling the past, namely the as warm 1930’s as seen in the US T-max temps in this post. The exact opposite of the adjustments that they should be making to correct UHI caused by urban sprawl.
NOT hard to understand why Govt agencies like NASA GISS wipe out the hot 1930’s and leave the UHI polluted current temps – because there would be no man-made “global warming” aka “climate change” problem if todays temps are the same, if not cooler, than the extreme 1930’s temps before human emissions could have had any significant effect on climate.
NASA’s MSU satellite measurement systems, generate the RSS and UAH datasets, which measure the average temperature of every cubic inch of the lower atmosphere (0-10 kms), which happens to be the exact place where anthropogenic global warming is meant to occur, according to anthropogenic global warming theory.
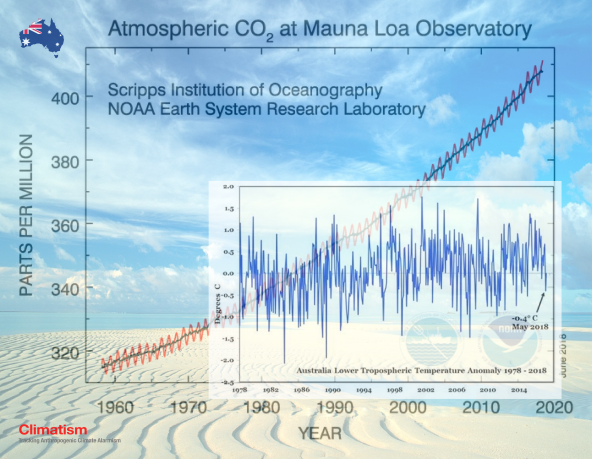
AUS MAY TEMPS -0.4C BELOW AVERAGE
UAH temperature anomaly for May was almost half a degree centigrade (-0.4C) below the 4o year average!
AUSTRALIA Lower Troposheric Temperature Anomaly 1978-2018
SATELLITES have the obvious benefit of measuring only the atmosphere and the effect that carbon dioxide emissions may be having on the atmosphere. Satellite data is not polluted by UHI (Urban Heat Island effect) – artificial heat generated from city infrastructure; asphalt carparks, airpots, highways, AC vents etc.
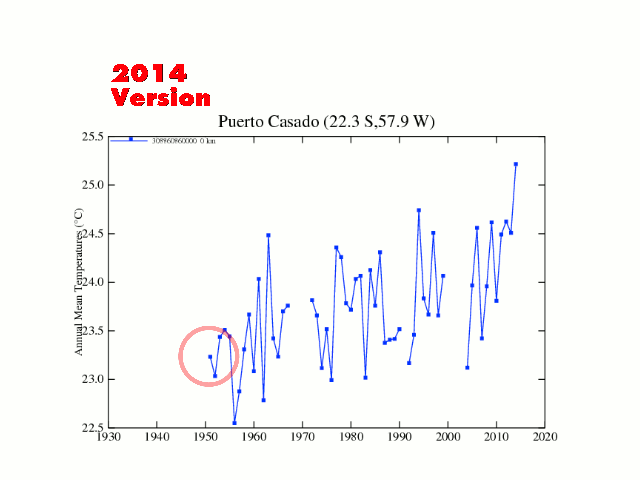
TONY Heller did a survey of the ten oldest stations in New South Wales And Victoria, circled below. Three rural stations were not included because of obvious problems with the data, but none showed any warming:
The two urban stations at Melbourne and Sydney both showed strong warming, and both have disastrously poor siting of their thermometers in the middle of large cities.
Melbourne Temperature Anomaly
Sydney Temperature Anomaly
By contrast, all of the rural stations show a long term cooling trend, with some recent warming. (Note that there is no data for the most recent years with some of the rural stations.)
ACCORDING to NASA data, the recent 0.56°C plunge in global temperatures, following the 2015/16 super El Niño, is the greatest two-year cooling event in a century. “You have to go back to 1982-84 for the next biggest two-year drop, 0.47°C—also during the global warming era.”
NASA’s MSU satellite measurement systems, generate the RSS and UAH datasets, which measure the average temperature of every cubic inch of the lower atmosphere (0-10 kms), the exact place where global warming theory is meant to occur.
MAY TEMPS +0.18C ABOVE AVERAGE
GLOBAL temps continue their cooling trend, rebounding off the 2015/16 Super El Niño – the strongest since accurate measurements began, caused by surface waters in the Pacific Ocean, west of Central America rising up to 3C warmer than usual.
GREENHOUSE GAS THEORY CHECK?
THE latest UAH V6.0 May anomaly of +0.18 brings temperatures back to the levels they were at the beginning of the Century, reinforcing the current 18+ year global warming “pause”, despite record and rising CO2 emissions…
UAH Global Temperature Update for May, 2018- +0.18 deg. C « Roy Spencer, PhD
Latest Global Average Tropospheric Temperatures
Since 1979, NOAA satellites have been carrying instruments which measure the natural microwave thermal emissions from oxygen in the atmosphere. The intensity of the signals these microwave radiometers measure at different microwave frequencies is directly proportional to the temperature of different, deep layers of the atmosphere. Every month, John Christy and I update global temperature datasets that represent the piecing together of the temperature data from a total of fifteen instruments flying on different satellites over the years. A discussion of the latest version (6.0) of the dataset is located here.
The graph above represents the latest update; updates are usually made within the first week of every month. Contrary to some reports, the satellite measurements are not calibrated in any way with the global surface-based thermometer records of temperature. They instead use their own on-board precision redundant platinum resistance thermometers (PRTs) calibrated to a laboratory reference standard before launch.
GLOBAL TEMPERATURE MEASUREMENTS – JUDGE FOR YOURSELF!
Satellites Vs Thermometers?
*
SATELLITES
NASA’s MSU satellite measurement systems, generate the RSS and UAH datasets, which measure the average temperature of every cubic inch of the lower atmosphere, the exact place where global warming theory is meant to occur. Read the rest of this entry »
“CLIMATE alarmism is a gigantic fraud: it only survives by suppressing dissent and by spending tens of billions of dollars of public money every year on pseudo-scientific propaganda.” – Leo Goldstein
EXCESSIVE or exaggerated alarm about a real or imagined threat is fundamental in driving the human CO2-induced global warming climate change narrative.
THE most popular climatic and weather-related events, as marketed by the Climate Crisis Industry, fall well within the bounds of natural variability. So, in order for such events to make the headlines, attract taxpayer funding for ‘research’, and advance the misanthropic, man-made climate change agenda, they must be accompanied by inflated language, an urgent tone, imagery of doom, and in many cases, fraudulent data.
IN this series we take an objective/sceptical look at ten of the more popular metrics used by warming alarmists to push the CAGW (catastrophic anthropogenic global warming) narrative, testing the veracity of the all-too-often wild and alarmist claims associated with each…
#2. SEA LEVEL RISE
“THE Seas Are Rising”! You’ve read it, seen it and heard about it just about everywhere in conjunction with the climate change debate. However, the very statement “rising sea levels” is deceptive from the start.
SEA-levels both rise and fall depending on where you are on the planet. Absolute sea-level varies from negative to positive to stabledepending on a range of regional factors including: local vertical land motion, land use, salinity, regional ocean circulations, ocean heat content and tidal variations…
THE climate-theory-obsessed mainstream media has gleefully pawned the emotional link between climate change and ‘sinking’ tropical islands to push their man-made global warming agenda…
“The tiny pacific island nation of Tuvalu looks set to become a victim of global warming, with the entire country predicted to be washed away in 50 years.”(BBC 2002)
TUVALU’s plight even formed part of the basis for arguably the most hysterical fake news claim in the history of climate alarmism: the UN’s prediction that by the end of 2010, climate change would have created “50 million environmental refugees”!
CLIMATISM, along with the climate sceptic “denier” community have been citing actual scientific data and empirical observations that have consistently contradicted the hysterical claims made by the mainstream media of “drowning island nations” for years…


Recent Comments