
A Stunning Indictment Of UHI
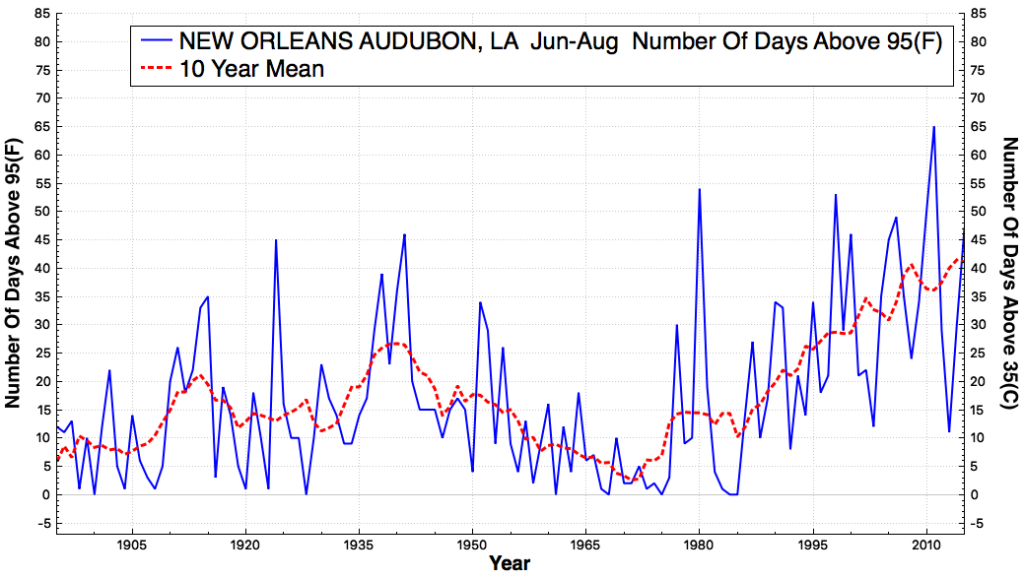
Posted: January 31, 2016 Filed under: Uncategorized Leave a commentNOAA and NASA say UHI isn’t important. Compare these two stations in Louisiana 50 miles apart.
Urban
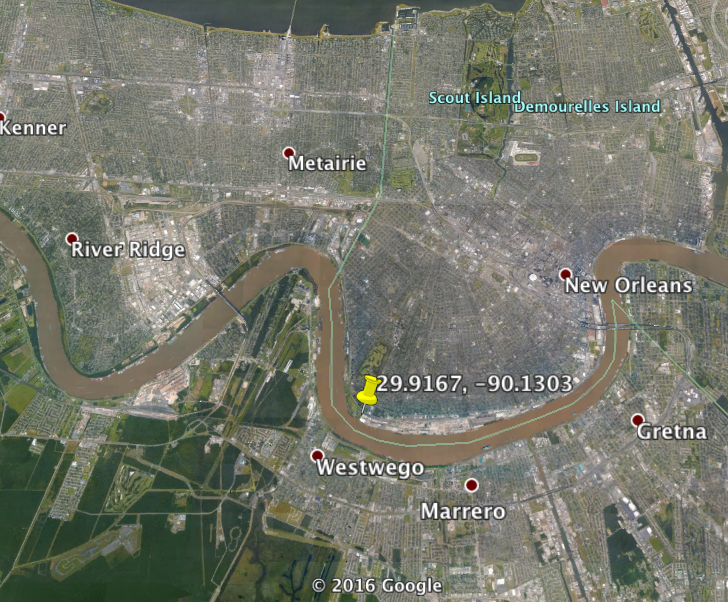
Rural

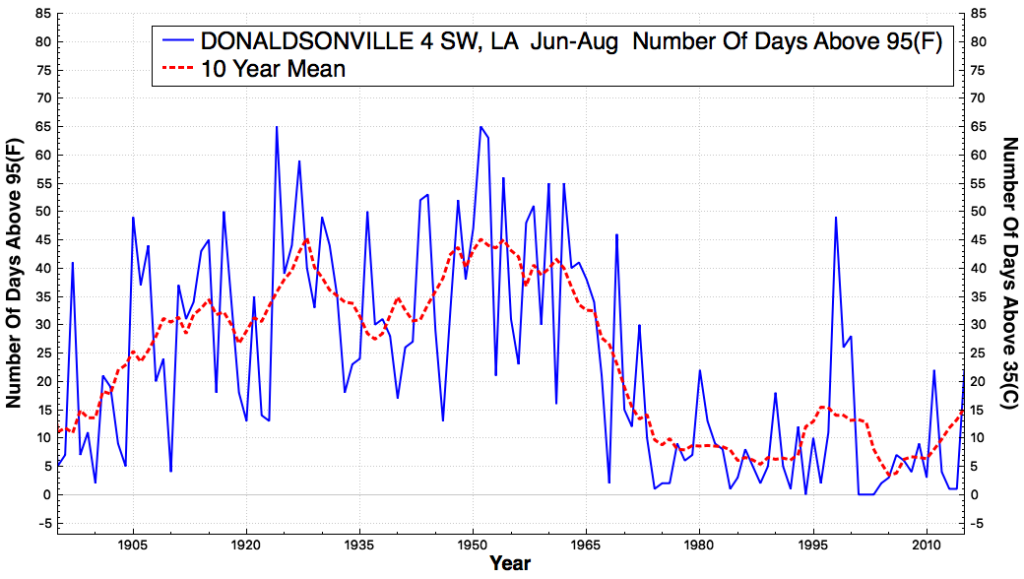
The frequency of hot days at the rural station has plummeted, while they have skyrocketed at the urban station. And then we get a double fraud through homogenization.
The Biggest Fraud In Science History
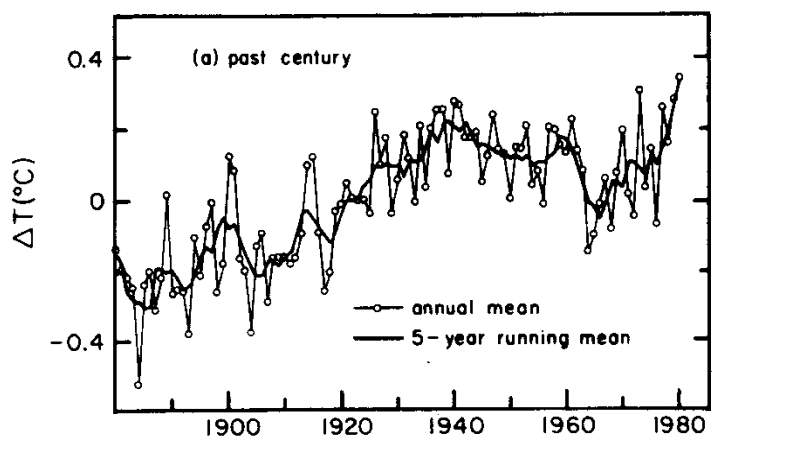
Posted: January 31, 2016 Filed under: Uncategorized 2 CommentsIn 1978, NOAA showed 0.6 degrees global cooling since 1975 at the surface and in balloon data. The cooling was present in both hemispheres.
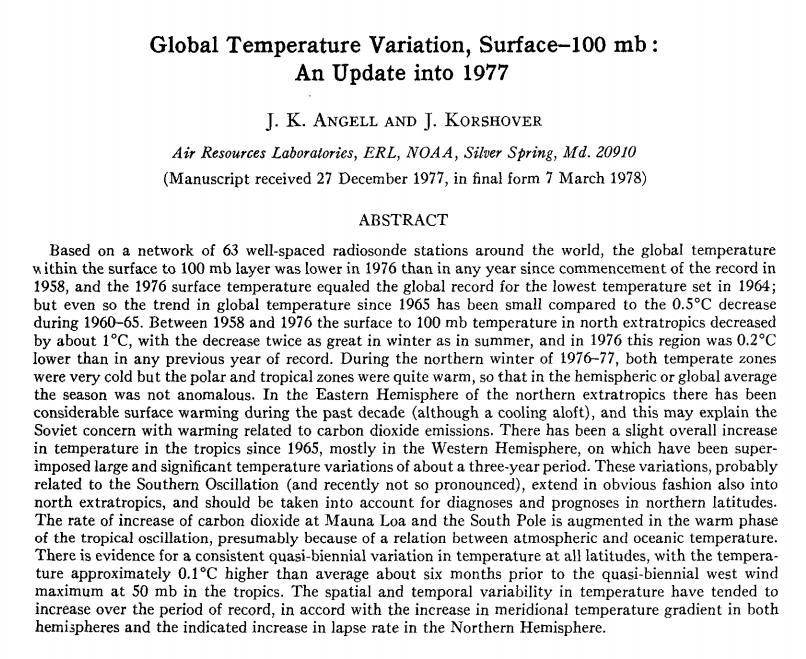
1520-0493(1978)106<0755:GTVSMA>2.0.CO;2
The National Academy of Sciences knew about this cooling in 1975.

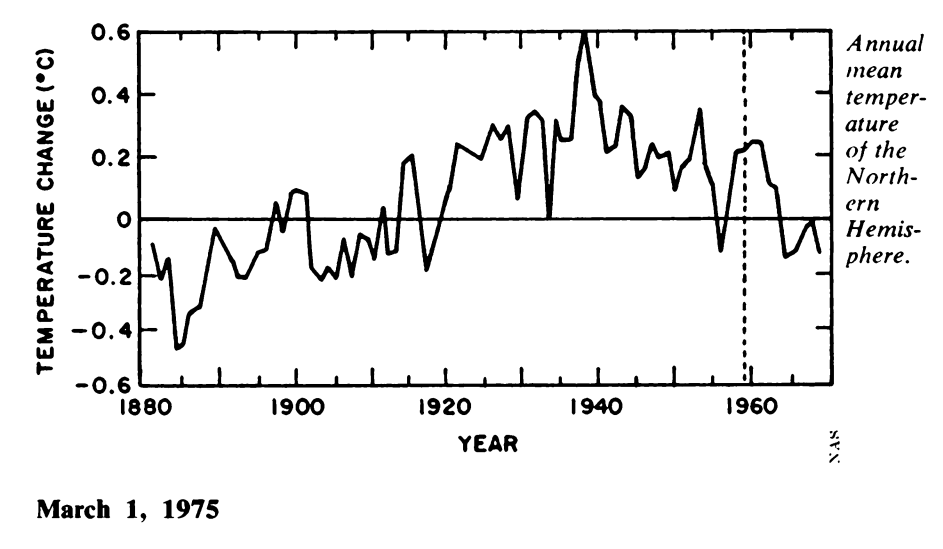
This cooling was seen in the vast majority of US stations and is still present in the untampered US data.
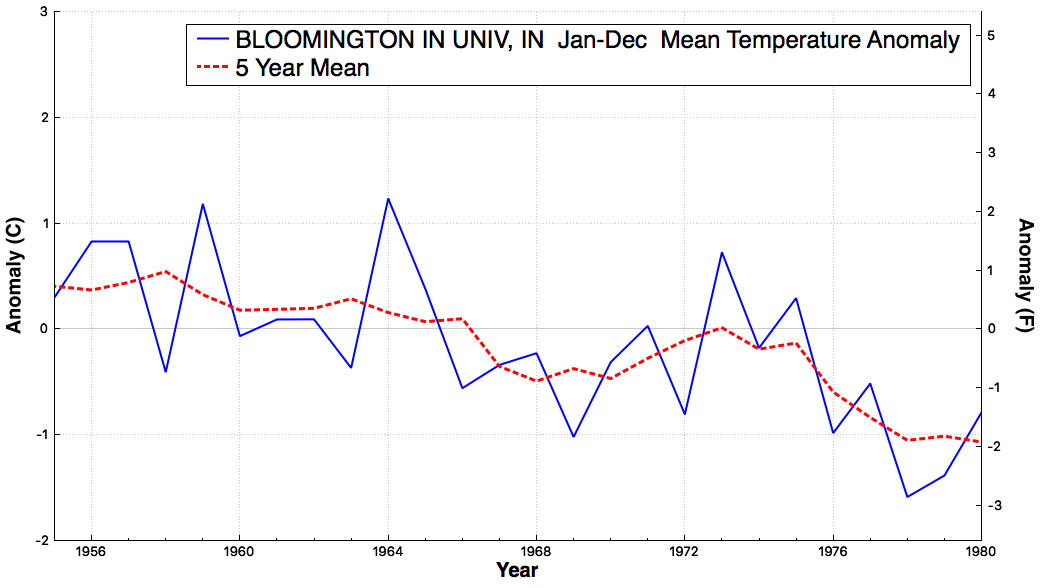
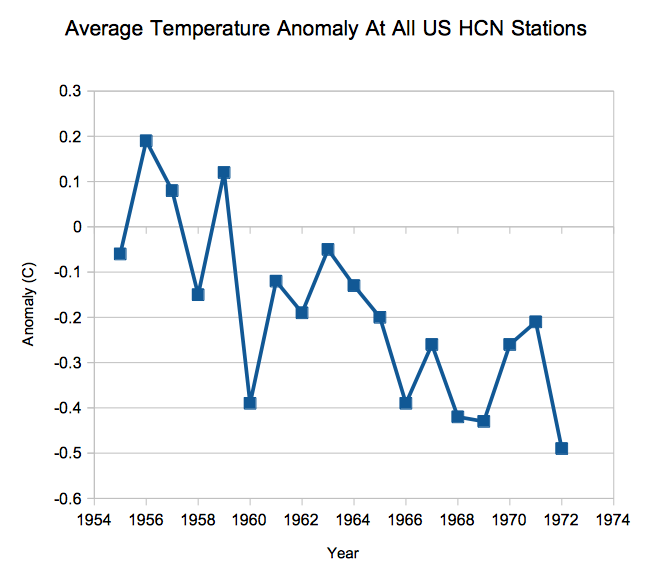
But for some reason, the cooling has disappeared from NASA data.
NASA used to show the cooling, but have since made it disappear.
Over the last 16 years, satellite and radiosonde data show cooling, which NASA has also erased.
Wood for Trees: Interactive Graphs
In 1989, Tom Karl at NOAA reported that almost all global warming occurred before 1919, and that Earth cooled from 1921 to 1979.
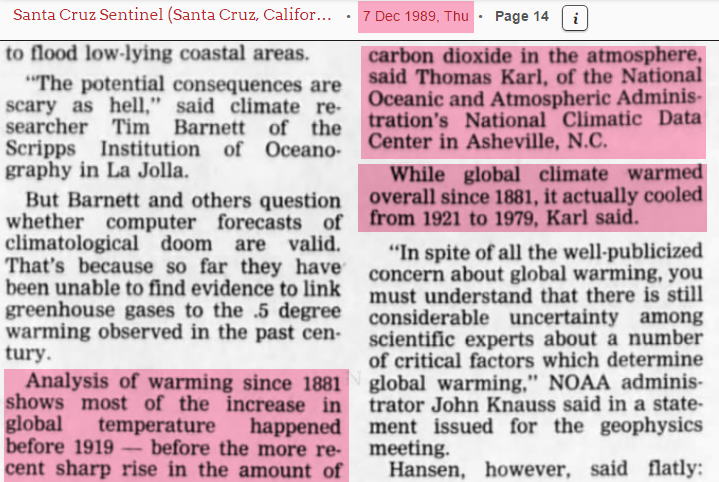
7 Dec 1989, Page 14 – at Newspapers.com
Tom Karl has since changed his story. Global warming is the biggest fraud in science history.
The Trouble With Hillary Clinton’s Aide
Posted: January 31, 2016 Filed under: Uncategorized Leave a commentWatch this space…
Wow.
 By Andrew Bolt ~
Bizarre. Troubling.
Huma Abedin is a close aide of Hillary Clinton, now a favorite to become the next President of the United States:
Huma Abedin, 39, … first worked for Hillary Clinton as a college intern in the White House in 1996 when Bill was president. She is now so close to the former secretary of state that she is regularly referred to as Clinton’s “shadow”, “secret weapon” and “surrogate daughter”.
When Clinton can’t work out how to work a fax machine, she summons Abedin. When Clinton sent an envoy to London last year to raise campaign cash from wealthy US expats, it was Abedin who made the trip…
From starting out as an intern, assigned to Clinton when she was first lady, Abedin went on to be Clinton’s deputy chief of staff at the State Department. Before that she was an assistant to Clinton…
View original post 1,101 more words
Pacifica, California’s Natural Coastal Erosion and the Lust for Climate Catastrophes
Posted: January 31, 2016 Filed under: Uncategorized Leave a commentGuest essay by Jim Steele
Director emeritus Sierra Nevada Field Campus, San Francisco State University
For 25 years I’ve lived in the beautiful town of Pacifica, California situated about 15 miles south of San Francisco. It was a wonderful place to raise a family. Its great expanse of green space is a delight for an ecologist. My daily hikes vary from coastal bluffs to watch feeding Humpback Whales or migrating Gray Whales, to inland mountain trails with abundant deer, coyotes and bobcats. Oddly this past week I received emails from friends around the country asking if I was “all right”, thinking my little slice of heaven was falling into the sea. Not to disrespect their concern, I had to belly laugh. The news of a few houses, foolishly built on fragile land too near the sea bluffs’ edge, were indeed falling into the ocean and were now providing great photo-ops…
View original post 2,507 more words
NOAA’s Adjusted SSTs Not Supported By Atmospheric Data
Posted: January 29, 2016 Filed under: Uncategorized Leave a commentBy Paul Homewood

Between 1979 and 2001, atmospheric temperatures above the oceans, as measured by UAH, rose slightly faster then sea surface temperatures as measured by NOAA’s ERSST series, the one now used in their global temperature datasets.
This is exactly what would be expected. As NASA explain:
Sea surface temperatures have a large influence on climate and weather. Even changes of just a few degrees Celsius can influence large-scale weather phenomena, such as El Niño or tropical cyclones. One reason for this big influence is that evaporation from the oceans is the primary source of water vapor in the atmosphere. The warmer the water, the greater the evaporation.
It is this process of evaporation which cools the oceans, and subsequently warms the atmosphere via condensation.
Moreover, temperature changes in the atmosphere tend to be greater than on the sea surface because of the much larger heat content of the…
View original post 64 more words
@NOAA ‘s desperate new paper: Is there no global warming ‘hiatus’ after all?
Posted: January 29, 2016 Filed under: Uncategorized Leave a commentWorth another read after ‘The Daily Caller’ article on NOAA’s junk temperature science :
“300 Scientists Want NOAA To Stop Hiding Its Global Warming Data”
http://dailycaller.com/2016/01/28/300-scientists-want-noaa-to-stop-hiding-its-global-warming-data/
Patrick J. Michaels
Richard S. Lindzen
Paul C. Knappenberger
A new paper published today by Science, from Thomas Karl and several co-authors[1], that removes the “hiatus” in global warming prompts many serious scientific questions.
The main claim[2] by the authors that they have uncovered a significant recent warming trend is dubious. The significance level they report on their findings (.10) is hardly normative, and the use of it should prompt members of the scientific community to question the reasoning behind the use of such a lax standard.
In addition, the authors’ treatment of buoy sea-surface temperature (SST) data was guaranteed to create a warming trend. The data were adjusted upward by 0.12°C to make them “homogeneous” with the longer-running temperature records taken from engine intake channels in marine vessels.
As has been acknowledged by numerous scientists, the engine intake data are clearly contaminated by heat conduction from the structure…
View original post 546 more words
The Economy Crushing Consequences of Massively Subsidised Wind Power
Posted: January 29, 2016 Filed under: Fact Check, Failed Green Schemes, Unreliables, Wind Farms Leave a commentGood read.

Reaping the carbon policy harvest
Catallaxy Files
Alan Moran
18 January 2016
For five years, Tata, the Indian firm that owns what used to be British Steel has been warning that energy costs in Britain are squeezing competitiveness.
Previous reductions have accelerated in 2015 with a 15 per cent cut in jobs.
Successive UK governments have responded by further turning the screws with now renewable energy requirements and other impacts. And each new announcement of retrenchments, like the most recent one, is met by anguished blame shifting and calls for specific supports.
Politicians the world over have a knack of etherealising their decisions on renewable energy as though they have no consequences.
Many have been conditioned by absurdities like the sun and wind is free so how can using this energy be adding to costs and their eyes glaze over when confronted by hard data demonstrating the renewals…
View original post 303 more words
Measuring global temperatures: Satellites or thermometers?
Posted: January 29, 2016 Filed under: Uncategorized Leave a commentBy Paul Homewood

http://www.cfact.org/2016/01/26/measuring-global-temperatures-satellites-or-thermometers/
This is a must read, and definitely worth a bookmark.
Guest post from Roy Spencer for CFACT:
The official global temperature numbers are in, and NOAA and NASA have decided that 2015 was the warmest year on record. Based mostly upon surface thermometers, the official pronouncement ignores the other two primary ways of measuring global air temperatures, satellites and radiosondes (weather balloons).
The fact that those ignored temperature datasets suggest little or no warming for about 18 years now, it is worth outlining the primary differences between these three measurement systems.
The primary ways to monitor global average air temperatures are surface based thermometers (since the late 1800s), radiosondes (weather balloons, since about the 1950s), and satellites measuring microwave emissions (since 1979). Other technologies, such as GPS satellite based methods have limited record length and have not yet gained wide acceptance for accuracy.
While the thermometers…
View original post 1,179 more words
300 Scientists Tell Chairman of the House Science Committee: ‘we want NOAA to adhere to law of the Data Quality Act’
Posted: January 29, 2016 Filed under: Uncategorized Leave a comment
The following letter has been sent to Chairman of the House Science Committee, Lamar Smith, regarding NOAA’s “pause buster” data shenanigans that we highlighted back in the summer of 2015.
The issue is with bad data, as Dr. Pat Michaels Dr. Richard Lindzen, and Dr. Chip Knappenberger observed related to the switch from buckets on a rope to engine water inlets for measuring sea surface temperature:
“As has been acknowledged by numerous scientists, the engine intake data are clearly contaminated by heat conduction from the structure, and as such, never intended for scientific use,” “Adjusting good data upward to match bad data seems questionable.”
I’ll say. As Bob Tisdale and I wrote back in June:
“If we subtract the ERSST.v3b (old) data from the new ERSST.v4 data, Figure 11, we can see that that is exactly what NOAA did.”
“It’s the same story all over again; the adjustments go…
View original post 531 more words
The Fraud Couldn’t Be Clearer
Posted: January 29, 2016 Filed under: Uncategorized 3 Comments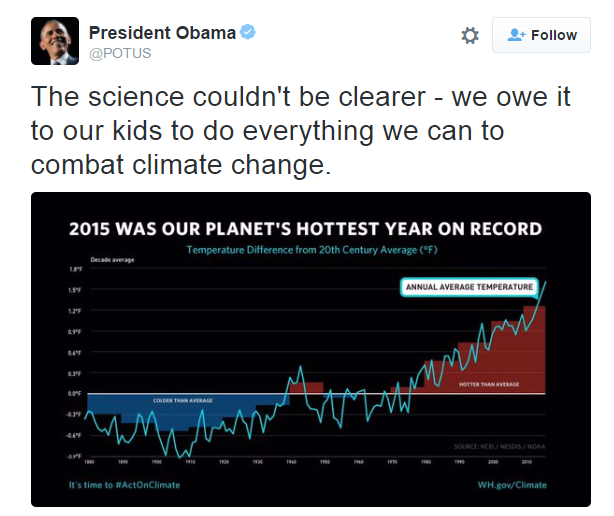
2015 was the most fraudulent year on record at the White House. Their claim is utter nonsense.
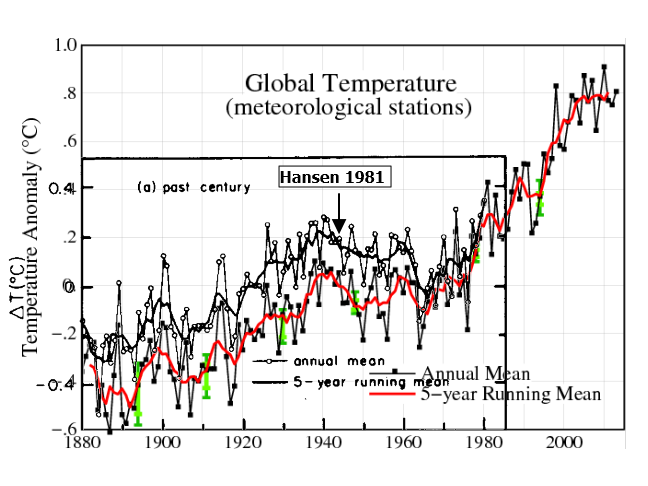
NASA’s surface temperature record shows 1.6C warming since the 1880’s, and 0.8C warming during the century from 1880 to 1980.
Their 1981 version of the same graph only shows a little over half that much warming from 1880 to 1980.
The next graph overlays the two above at the same scale, normalized to the late 1970’s. NASA has massively cooled the past, far outside of their own error bars.
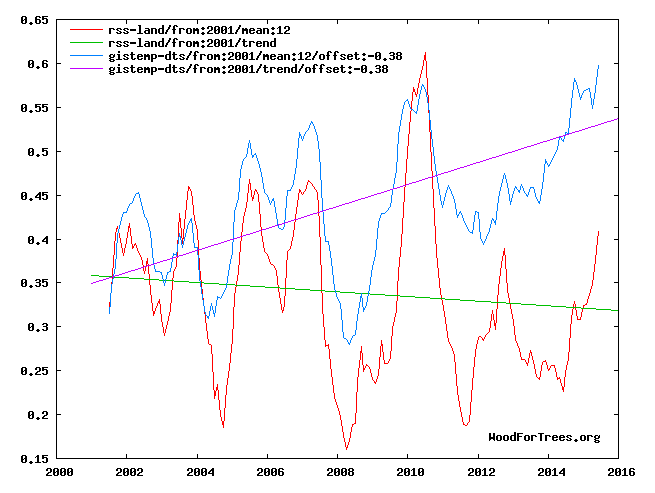
They added about 0.3C warming prior to 1980 by altering the data, and show another 0.2C warming since 2001, during a time when satellites show cooling.
Wood for Trees: Interactive Graphs
Most of their surface temperatures are fake. There are vast areas of land with little or no temperature readings, and many of the thermometers they do have are contaminated by urban heat island effects.
View original post 92 more words


Recent Comments