
EPJ Scientific Study : There Is No ‘Climate Crisis’
Posted: February 8, 2022 Filed under: Climate Change, Climate Crisis, Climate science, Climatism, Science | Tags: Climate Change, Climate Crisis, Climate science, Climatism, Eco-socialism, Global Temperature, UAH 6 CommentsINCONVENIENT study out of the esteemed EU Physical Journal Plus (EPJ) reaffirming that the “Climate Crisis” narrative is yet another deliberate and deceitful eco-slogan designed to frighten you into belief and compliance.

A critical assessment of extreme events trends in times of global warming | SpringerLink
Key quote: “…on the basis of observational data, the climate crisis that, according to many sources, we are experiencing today, is not evident yet.”
•
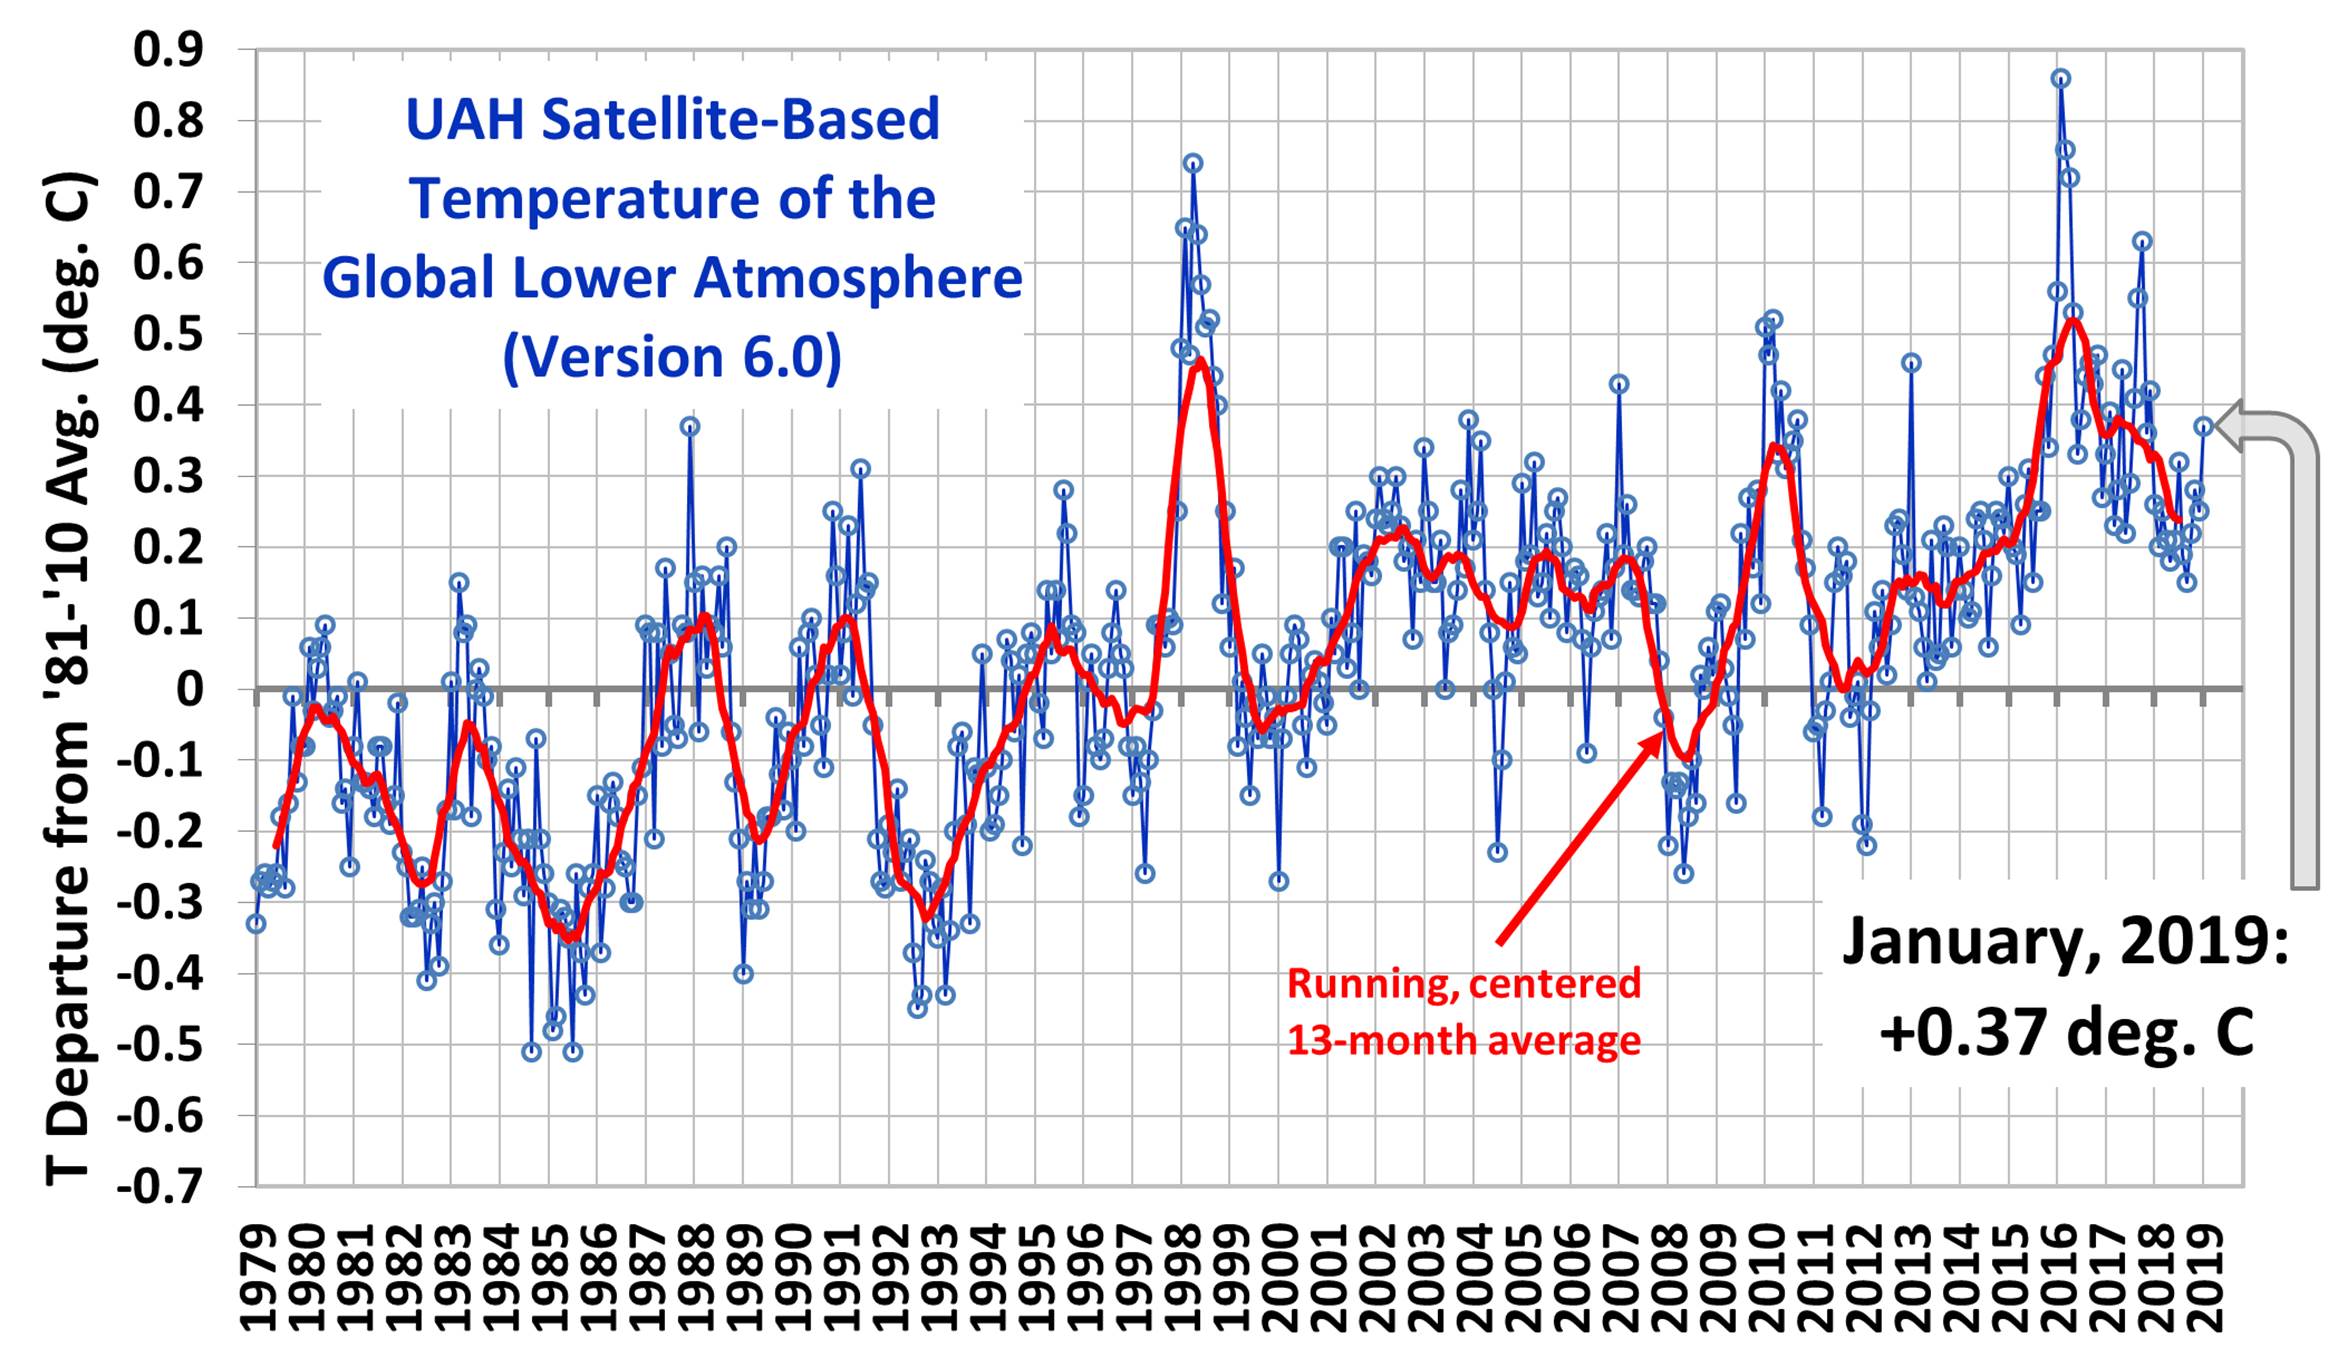
The latest global temp data from UAH / NASA satellites shows that “global warming” is not a “crisis” either. January anomaly indicating a mere 0.03°C rise in global temps above the 40 year average.

•
EXTREME WEATHER related :
UAH / NASA Satellite Global Temperature related :
NO GLOBAL WARMING : Global Temperature Now 0.01 Degrees Below Average
Posted: April 4, 2021 Filed under: Climate Change, Climatism, Global Temperature, Global Warming, NASA | Tags: carbon dioxide emissions, Climate Change, Climatism, CO2, Global Temperature, Global Warming, Green New Deal, MSU, nasa, NOAA, UAH, WMO 8 Comments
SOME might argue that the latest global temperature, as measured by x15 NASA/NOAA AMSU (advanced microwave sounding unit) satellites, measuring literally every square inch of the lower troposphere (the exact place where ‘man-made global warming’ is supposed to occur) might be an anomaly caused by the de-industrialisation experiment carried out during draconian COVID-19 lockdowns.
Not so, according to the UN’s own meteorological agency, the WMO.
They concluded that despite the draconian COVID-19 lockdowns that initiated the greatest de-industrialisation science experiment ever carried out in human history, CO₂ levels failed to drop…
Ergo, if CO₂ concentrations didn’t budge, at all, during the most comprehensive global science experiment ever undertaken in mankind’s history, then how do we know that they are even ‘ours’ to ‘bring down’?
NOAA current data reveals that global CO₂ levels are higher now, not lower, than at the same period in 2020.

Global Monitoring Laboratory – Carbon Cycle Greenhouse Gases | NOAA
So, if CO₂ levels are naturally increasing, then why is the global atmospheric temperature, according to NASA’s own MSU satellites, now below the 40 year average?
LATEST NASA/NOAA SATELLITE, GLOBAL TEMPERATURE ANOMALY
Via Dr. Roy Spencer
UAH Global Temperature Update for March 2021: -0.01 deg. C « Roy Spencer, PhD
April 2nd, 2021 by Roy W. Spencer, Ph. D.
The Version 6.0 global average lower tropospheric temperature (LT) anomaly for March, 2021 was -0.01 deg. C, down substantially from the February, 2021 value of +0.20 deg. C.
REMINDER: We have changed the 30-year averaging period from which we compute anomalies to 1991-2020, from the old period 1981-2010. This change does not affect the temperature trends.
Right on time, the maximum impact from the current La Nina is finally being felt on global tropospheric temperatures. The global average oceanic tropospheric temperature anomaly is -0.07 deg. C, the lowest since November 2013. The tropical (20N-20S) departure from average (-0.29 deg. C) is the coolest since June of 2012. Australia is the coolest (-0.79 deg. C) since August 2014. The linear warming trend since January, 1979 remains at +0.14 C/decade (+0.12 C/decade over the global-averaged oceans, and +0.18 C/decade over global-averaged land). UAH Global Temperature Update for March 2021: -0.01 deg. C « Roy Spencer, PhD
•
COMMENT from Andrew Bolt, on the money, again …
After decades of alarmism about global warming frying the planet, the latest UAH satellite measures show warming of 0.01 [below] the average at the end of last century. No warming at all. And nothing that could cause all the catastrophes that have been claimed. You’ve heard this news on the ABC, right? No?
•
Background on AMSU (UAH/RSS data) satellites:
NASA/NOAA AMSU ATMOSPHERIC SATELLITES
NASA’s 15 MSU and AMSU satellites generate the RSS and UAH datasets, which measure the average temperature of every cubic inch of the lower troposphere, the exact place where global warming climate change theory is meant to occur.
UAH (University Alabama Huntsville) satellite data set run by Dr. John R. Christy – Distinguished Professor of Atmospheric Science and Director of the Earth System Science Center at The University of Alabama in Huntsville, and Roy Spencer Ph.D. – Principal Research Scientist at UAH.
Via : THE Catastrophic Anthropogenic Global Warming Scam | Climatism
•
See also :
- THE Catastrophic Anthropogenic Global Warming Scam | Climatism
- SURPRISE, SURPRISE! Global Lockdown Every Two Years Needed To Meet Paris CO₂ Goals | Climatism
JAPAN ACKNOWLEDGES THE GLOBAL WARMING ‘PAUSE’ : Sanctions 35 New Coal Power Plants Added To The 100 Currently Operational
Posted: February 22, 2019 Filed under: Alarmism Debunked, Climate science, Climategate, Climatism, CO2, Empirical Evidence, Failed Climate Models, Fossil Fuels, Global Temperature, Green New Deal, Satellite Data, State Of The Climate, The Pause | Tags: "The Pause", Climate Change, Climate science, Climategate, coal, Fossil Fuels, Fukushima, Global Temperature, Global Warming, Global Warming Hiatus, Green New Deal, HELE, Japan, Japan Meteorological Agency (JMA), JMA, Prime Minister Shinzō Abe, Satellite Data, Ultra-Supercritical Coal Power Plant, Vijay Jayaraj, warming pause 6 Comments
Sushi, Sake, and Coal: Japan’s Peculiar Response to the Climate Conundrum » BarbWire
“The fact is that we can’t account for the lack of warming
at the moment and it is a travesty that we can’t.”
– Kevin Trenberth, National Center For Atmospheric Research, USA (2009)
“Observations do not show rising temperatures throughout the
tropical troposphere … This is just downright dangerous.”
– Peter Thorne, Hadley Centre, Met Office, UK (2007)
***
THE Japanese government has identified and acknowledged the current ~20 year-long global warming “pause” or “hiatus”. The (inconvenient) atmospheric phenomenon that has been the subject of much research and debate in peer-reviewed scientific journals for many years now.
BASED on data from the Japan Meteorological Agency (JMA), the government has justified the expansion of its global-leading, ultra-supercritical HELE coal-fired power plant technology both domestically and abroad.
PRIME MINISTER Abe has sanctioned the addition of 35 new coal power plants to the 100 currently operational.
“Japan’s use of coal is not justified exclusively on the basis of the country’s nuclear debacle. The heart of the reason is Japan’s climate.
For the past three decades, there has been no significant warming in its major cities.”
*
CLIMATE Scientist Vijay Jayaraj reports (Climatism attachments, bolds added) :
Sushi, Sake, and Coal: Japan’s Peculiar Response to the Climate Conundrum
We all know that the Japanese love their sushi. Japan is also famous for sake, a rice wine unique to the country. Lately, the Japanese have shown unrestrained love for a commodity that is increasingly demonized by climate groups: coal.
Global warming alarmists blame coal for causing dangerous global warming. But the Japanese beg to differ. They have revived their love affair with coal. Why? That’s an interesting story.
Soon after the Fukushima nuclear incident, public sentiment towards nuclear energy became hostile. Many organizations, including foreign non-profits, called for the closure of nuclear plants on fears of future mishaps.
The Fukushima plant was outdated and less safe than Japan’s other, modern nuclear plants. Yet, the impact of the Fukushima disaster (in which no one died from radiation exposure) remains fresh in people’s minds, and the nation was not ready to defend the operations of other nuclear plants.
The Japanese government caved in to the pressure and closed many nuclear plants. By 27 March 2012, Japan had only one out of 54 nuclear reactors operating. As a result, the country was forced to seek alternative sources of energy generation.
The Japanese understood that renewable sources like wind and solar could not provide stable and affordable electricity, at least not in the magnitude necessary to meet peak energy demands of Japan’s power-guzzling cities.
The most economical and safe solution was coal. Contrary to popular belief and the mainstream media, coal is not as polluting as you might think.
Moreover, coal is a tried and tested source of energy, guaranteeing superior-quality, stable output to meet the energy demands of modern cities and industries.
With the development of “clean coal technology,” coal combustion now results in fewer contaminants and more energy, making it far superior to the combustion plants of previous decades.

So, Japan went against the tide and embraced coal with both arms.
It now employs the most advanced and safest coal combustion technology available on the planet, becoming a leading manufacturer and exporter of clean coal technology.
But Japan’s use of coal is not justified exclusively on the basis of the country’s nuclear debacle. The heart of the reason is Japan’s climate.
For the past three decades, there has been no significant warming in its major cities.
Data from the Japan Meteorological Agency (JMA) clearly indicates that there has been no significant deviation in the monthly average temperature between 1998 and 2018. The period between is of special importance to the Japanese government.

As per the climate doomsday theorists, temperatures should have displayed a strong warming trend as the manmade carbon dioxide emissions increased exponentially.
But the temperature levels failed to display any warming trend. That flies in the face of the notion that atmospheric carbon dioxide concentration levels control temperature over the island nation—or, for that matter, the world.
Last week, Sapporo recorded its coldest day in 40 years. In fact, winter in Japan had no warming trend from 1986 to 2018, with the January monthly mean temperature anomalies displaying a cooling trend. If anything, there has been a cooling trend in Japan between 1998 and 2018.
So, the reason for Japanese embrace of coal is pretty clear: no significant warming, coupled with the post-Fukushima anti-nuclear hysteria.
No country would want to reduce its emissions when its monthly average temperatures are actually decreasing. It is for this reason that Japanese Prime Minister Shinzō Abe refuses to stay true to the hasty anti-coal commitments he made at the UN’s international climate summits.
Instead of discouraging the use of coal, Japan is increasing its dependency on coal. Abe has sanctioned the addition of 35 new coal power plants to the 100 currently operational. The country is also encouraging its Asian neighbors and other developing countries to purchase its clean coal technology.
The Japanese response to the anti-coal establishment, besides being bold, accurately reflects climate reality. Japan understands the need to prioritize the domestic energy needs over faulty, pseudo-scientific forecasts of climate doom.
The lack of warming, however, is not limited to Japan. Satellite temperature measurements (between 1979 and January 2019) show no significant warming in the earth’s atmosphere during the past 19 years.
Other countries should emulate Japan’s example, especially in the developing world. Domestic energy needs are far too important to be slain on the altar of global warming hysteria.
Sushi, Sake, and Coal: Japan’s Peculiar Response to the Climate Conundrum » BarbWire
![]()
REFRESHING to see government energy policy being driven by empirical evidence and real-world data, and NOT by fear, hysteria, mainstream media climate change advocacy and alarmism or politically-driven, CO2-centric, UN IPCC climate models.
BRAVO Japan for standing up to the climate groupthink bullies and misanthropic eco-activists. Instead, supporting their industry and citizens by providing them with cheap, abundant and clean (HELE) coal-fired power technology to advance and maintain their world-renowned pristine environment, civic cleanliness, health and wealth!
“The Japanese response to the anti-coal establishment, besides being bold, accurately reflects climate reality. Japan understands the need to prioritize the domestic energy needs over faulty, pseudo-scientific forecasts of climate doom.”
***
PIC of Kinkaku-ji Palace Kyoto from my recent family trip to ‘pristine’ HELE powered Japan!
IF you haven’t been to Japan – GO! Incredible people, culture and country…

Jamie Japan Trip – Kinkaku-ji Royal Palace Kyoto – Jan 2019 (iPhone 8 – No filter!)
•••
SEE also :
- THE Great Global Warming “Pause” | Climatism
- 100% Of Climate Models Prove that 97% of Climate Scientists Were Wrong! | Climatism (CMIP5 Climate Models)
- FATHER Of The 2°C Climate Target Admits Number Is Fabricated : ‘Two degrees is not a magical limit; it’s clearly a political goal’ | Climatism (UN IPCC)
- CLIMATE CHANGE : The Unsettled Science Of “Settled” Science | Climatism (ECS)
PEER-REVIEWED SCIENCE : The Medieval Warm Period Was Indeed Global And Warmer Than Today
Posted: December 3, 2018 Filed under: Alarmism Debunked, Alarmism uncovered, Climate Change, Climate History, Climatism, COP24, Empirical Evidence, Fact Check, Global Cooling, Global Temperature, Global Warming, Medieval Warm Period, Pal-Review, Science, State Of The Climate | Tags: Climate Change, Climate history, Climatism, COP24, global cooling, Global Temperature, Global Warming, Grand Solar Minimum, Katowice, Medieval Warm Period, nature, Peer Review, Peer review study, science, Science and Environment, UN IPCC, UNFCCC 6 Comments
The Medieval Warm Period – A Global Phenomenon
“No matter if the science of global warming is all phony…
climate change provides the greatest opportunity to
bring about justice and equality in the world.”
– Christine Stewart,
fmr Canadian Minister of the Environment
“We’ve got to ride this global warming issue.
Even if the theory of global warming is wrong,
we will be doing the right thing in terms of
economic and environmental policy.“
– Timothy Wirth,
President UN Foundation
***
WHEN prosecuting the case for “unprecedented” man-made Global Warming, the first thing you need to make sure of is that no recent climate era was as warm or warmer than the present, even if that means having to rewrite the past to fit your narrative.
THE Medieval Warm Period, also known as the Medieval Climate Optimum (due to conditions favoured for crops, life and civilisation to thrive) existed a short time ago in the climate record, from c. 950 to c. 1250., and has remained a thorn in the side, ever since, for today’s Global Warming Climate Change activist movement.
*
IN the 1990 IPCC report, the Medieval Warm Period was much warmer than the late 19th century:

*
THE IPCC’s 1990 report dives deeper into the reality of the Medieval Warm Period and provides an insight into the cause of these warming periods:
“This period of widespread warmth is notable in that there is no evidence that it was accompanied by an increase of greenhouse gases.”
*
BY the 2001 IPCC report, the Medieval Warm period disappeared and became much cooler than the late 20th century:

Mikey Mann Hockeystick
*
BY pure coincidence, in the year 1995 the IPCC made a decision to make the Medieval Warm Period disappear:

David Deming Senate Testimony
*
YOUTUBE clip of Dr David Deming’s US Senate testimony on the “disappearance” of the Medieval Warm Period (see 01m:50s) :
Video of Dr David Deming’s statement to the U.S. Senate Committee on Environment & Public Works on December 6, 2006. Dr Deming reveals that in 1995 a leading scientist emailed him saying “We have to get rid of the Medieval Warm Period”. A few years later, Michael Mann and the IPCC did just that by publishing the now throughly discredited hockey stick graph.
IN case you missed it…
“I had another interesting experience around the time my paper in Science was published. I received an astonishing email from a major researcher in the area of climate change. He said, “We have to get rid of the Medieval Warm Period.””
The existence of the MWP had been recognized in the scientific literature for decades. But now it was a major embarrassment to those maintaining that the 20th century warming was truly anomalous. It had to be “gotten rid of.””
Statement of Dr. David Deming | U.S. Senate Committee
*
THE MEDIEVAL WARM PERIOD : GLOBAL and PEER REVIEWED
ACCORDING to multiple lines of “peer-reviewed science”, the Medieval Warm Period was indeed ‘global’ and was as warm, if not warmer than today.
CLICK here for excellent interactive map of clickable peer-reviewed MWP studies in both North and Southern Hemispheres :
*
THE ‘INCONVENIENT’ PAST
THERE is absolutely nothing unusual about today’s so-called Global Warming aka Climate Change.
LOOK at how many periods of warmth our planet has enjoyed during the past 10,000 years alone.
CIVILISATIONS flourished during those warm periods (“climate optimums”), and collapsed when they ended.
DID humans cause the Minoan warm period of about 3,300 years ago?
DID humans cause the Roman warm period of about 2,100 years ago?
DID humans cause the Medieval warm period of about 1,000 years ago?
WHAT about all of those other warm periods? Should we blame Fred Flintstone, perhaps?

via @BigJoeBastardi | Twitter
IF the downward trend in temperature of the past 3,300 years continues, we could be in a heap of trouble. While our leaders keep on wringing their collective hands over global warming, we could be blindsided by an ice age.
ALL this talk about human-caused global warming is sheer nonsense, if not downright fraud. The record shows that both periods of warmth – and periods of cold – hit our planet with almost consistent regularity.
* Read the rest of this entry »
GLOBAL Temperature Drops By 0.4°C In Three Years
Posted: December 1, 2018 Filed under: Climate Change, Empirical Evidence, Fact Check, Global Temperature, Grand Solar Minimum, State Of The Climate | Tags: Climate Change, Climate science, Climatism, COP24, Eddie Minimum, Global Temperature, Global Warming, Grand Solar Minimum, HadCRUT, Science and Environment, State Of The Climate 2 CommentsMother Nature, yet again, doing her best to bury the failed global warming theory. Mainstream media silent, of course…
SEE also :
By Paul Homewood
From David Whitehouse:

In a press release the World Meteorological Organisation said,
‘
The main message was echoed by others, such as the BBC.
Likewise the Guardian:
It all goes to show how temperature data can be misrepresented if you don’t show the temperature data itself.
Fig 1 is the HadCRUT4 monthly global temperature from the UK Met Office.

As you can see a graph tells a very different story. The past decade has a climate change contribution but what elevates the past four years above the previous ones is an El Nino event, the strongest one on record. As we have said many time before an El Nino is not a climatic phenomenon, it is weather. What’s more, after its peak in 2016 the global temperature has fallen by around 0.4° C. The past four years being the warmest on record is true, but it has…
View original post 349 more words
GLOBAL Temperatures Rose As Cloud Cover Fell In the 1980s and 90s
Posted: October 31, 2018 Filed under: Climate science, Global Temperature | Tags: Albedo, Climate Change, Climate science, Cloud albedo, Cloud Cover, Clouds, COP24, environment, Global Temperature, Global Warming, nature, Nature and Environment 1 Comment
Figure 1a showing the ISCCP global averaged monthly cloud cover from July 1983 to Dec 2008 over-laid in blue with Hadcrut4 monthly anomaly data. The fall in cloud cover coincides with a rapid rise in temperatures from 1983-1999. Thereafter the temperature and cloud trends have both flattened. The CO2 forcing from 1998 to 2008 increases by a further ~0.3 W/m2 which is evidence that changes in clouds are not a direct feedback to CO2 forcing.
Good find. Makes sense.
By Paul Homewood
We’ve been discussing the sudden rise in UK and European temperatures in the 1990s, and I was reminded about a study undertaken by Clive Best and Euan Mearns looking at the role of cloud cover four years ago:

Clouds have a net average cooling effect on the earth’s climate. Climate models assume that changes in cloud cover are a feedback response to CO2 warming. Is this assumption valid? Following a study with Euan Mearns showing a strong correlation in UK temperatures with clouds, we looked at the global effects of clouds by developing a combined cloud and CO2 forcing model to sudy how variations in both cloud cover [8] and CO2 [14] data affect global temperature anomalies between 1983 and 2008. The model as described below gives a good fit to HADCRUT4 data with a Transient Climate Response (TCR )= 1.6±0.3°C. The 17-year hiatus in…
View original post 290 more words
GLOBAL TEMPERATURE PLUNGE : Coolest September In The Last 10 Years
Posted: October 3, 2018 Filed under: Climatism, Failed Climate Models, Global Cooling, Global Temperature, Grand Solar Minimum, State Of The Climate | Tags: carbon dioxide emissions, Climate Change, Climate science, Climatism, CMIP5, CO2, COP24, ECS, El Nino, failed climate models, Gavin Schmidt, global cooling, Global Temperature, Global Warming, Grand Solar Minimum, La Niña, nasa, NASA GISS, nature, NOAA, RSS, UAH Leave a comment
“We’ve got to ride this global warming issue.
Even if the theory of global warming is wrong,
we will be doing the right thing in terms of
economic and environmental policy.“
– Timothy Wirth,
Fmr President of the UN Foundation
***
GLOBAL atmospheric temperatures continue their rapid decline off the record heights of the 2016 super El Niño, despite record and rising CO2 emissions.
UAH global average lower tropospheric temperature (LT) anomaly for September, 2018 was +0.14°C, down from +0.19°C in August:

Latest Global Average Tropospheric Temperatures
Since 1979, NOAA satellites have been carrying instruments which measure the natural microwave thermal emissions from oxygen in the atmosphere. The intensity of the signals these microwave radiometers measure at different microwave frequencies is directly proportional to the temperature of different, deep layers of the atmosphere. Every month, John Christy and I update global temperature datasets that represent the piecing together of the temperature data from a total of fifteen instruments flying on different satellites over the years. A discussion of the latest version (6.0) of the dataset is located here.
The graph above represents the latest update; updates are usually made within the first week of every month. Contrary to some reports, the satellite measurements are not calibrated in any way with the global surface-based thermometer records of temperature. They instead use their own on-board precision redundant platinum resistance thermometers (PRTs) calibrated to a laboratory reference standard before launch.
*
THE September anomaly represents a 0.72°C drop since 2016 super El Niño heights, bringing temps down now to ~1988 levels.
DON’T expect the mainstream media to report in this anytime soon. They are only concerned about hot and climbing temperatures to push their global warming climate change agenda.
*
CO2 CONCENTRATION Vs TEMPS – Correlation?

CO2 Vs Temp Correlation 1979 – SEP 2018 – CLIMATISM
*
GLOBAL TEMPERATURE MEASUREMENTS – You Be The Judge!
Satellites Vs Land-Based Thermometers?

Satellites Vs Thermometers?
SATELLITES
NASA’s MSU satellite measurement systems, generate the RSS and UAH datasets, which measure the average temperature of every cubic inch of the lower atmosphere, the exact place where global warming theory is meant to occur.
BEFORE 2016, UAH and RSS both tracked closely showing very little warming in their data sets which led to the identification and validation of “the pause” in global warming which has since become the subject of much research and debate in peer-reviewed scientific journals.
From the RSS website:
“The simulation as a whole are predicting too much warming” – RSS

Source: http://www.remss.com/research/climate Archived here – http://www.webcitation.org/6fiQcrQDQ
HOWEVER, by 2016, Carl Mears, who is the chief scientist for RSS (Remote Sensing Systems) and who has used the pejorative “denialist” in various correspondence, decided that “the pause” was not a good look for the global warming narrative so RSS was massively adjusted upwards, conveniently eliminating “the pause” in the RSS dataset.
MEARS’ objectivity towards the business of global temperature data collection and reporting can be found in his commentary on his website:

Source: http://www.remss.com/blog/recent-slowing-rise-global-temperatures Archived here: http://www.webcitation.org/6fiS2rI7k
MEARS then published a paper claiming that new and improved adjustments have “found” that missing warming.
Mears, C., and F. Wentz, 2016: Sensitivity of satellite-derived tropospheric
temperature trends to the diurnal cycle adjustment. J. Climate. doi:10.1175/JCLID-
15-0744.1, in press.
http://journals.ametsoc.org/doi/abs/10.1175/JCLI-D-15-0744.1?af=R
THE result…
Differences between the old version and new version of RSS:

*
UAH NASA SATELLITE (Featured)
UAH is the satellite data set featured in this post and is jointly run by Dr. John R. Christy – Distinguished Professor of Atmospheric Science and Director of the Earth System Science Center at The University of Alabama in Huntsville. And Roy Spencer Ph.D. Principal Research Scientist at the University of Alabama in Huntsville.
SPENCER commentary on the divergence between RSS and UAH post “adjustment”:
“We have a paper in peer review with extensive satellite dataset comparisons to many balloon datasets and reanalyses. These show that RSS diverges from these and from UAH, showing more warming than the other datasets between 1990 and 2002 – a key period with two older MSU sensors both of which showed signs of spurious warming not yet addressed by RSS. I suspect the next chapter in this saga is that the remaining radiosonde datasets that still do not show substantial warming will be the next to be “adjusted” upward.
The bottom line is that we still trust our methodology. But no satellite dataset is perfect, there are uncertainties in all of the adjustments, as well as legitimate differences of opinion regarding how they should be handled.
Also, as mentioned at the outset, both RSS and UAH lower tropospheric trends are considerably below the average trends from the climate models.
And that is the most important point to be made.”
Comments on the New RSS Lower Tropospheric Temperature Dataset « Roy Spencer, PhD
(Climatism bolds)
* Read the rest of this entry »
GLOBAL Temps Continue Plunge Despite “Global Heatwave” Howls From Media Hysterics
Posted: September 2, 2018 Filed under: Alarmist media, Climatism, Extreme Weather, Global Temperature, Heat Wave | Tags: Alarmism, Alarmist Media, Climate Change, Climate science, Climatism, Fake News, Global Temperature, Global Warming, Heatwave, Hottest Year Ever, Mainstream media, nature, science, Science and Environment, UAH 1 Comment
Warming fears are the “worst scientific scandal in the history…When people come to
know what the truth is, they will feel deceived by science and scientists.” – UN IPCC
Japanese Scientist Dr. Kiminori Itoh, an award-winning PhD environmental physical
chemist.
“It is a blatant lie put forth in the media that makes it seem there is only a fringe of
scientists who don’t buy into anthropogenic global warming.” – U.S Government
Atmospheric Scientist Stanley B. Goldenberg of the Hurricane Research Division of
NOAA.
“I am a skeptic…Global warming has become a new religion.” – Nobel Prize Winner for
Physics, Ivar Giaever.
•••
LOWER troposphere global temperatures continue their decline off the 2015/16 Super El Niño highs.
AUGUST temps plunged off the July bump of +0.32 deg. C, cooling back to +0.19 deg. C above the long-term average.
THE August anomaly drop brings global temps back to 2002 levels…

*
LUCKY BREAK!
AT the start of the month ‘Science Alert’ reported that “We’re Going to Die in Record Numbers as Heatwaves Bake The World…”

*
A global wave of “Extreme Media” followed the purported “Global Heatwave” of late July/early August that had the climate ambulance chasing, global warming theory-obsessed media in hysterics…

*
THE end is nigh!

*
MET office climate scientist alarmist Peter Stott knows that science is about censorship, not debate…

*
HEATWAVES in summer – ‘Unprecedented’? Not…

*
2018 UK summer will not be hotter than 1976…
SEE : Hottest Summer Evah? Not According To CET. | NOT A LOT OF PEOPLE KNOW THAT
*
SANITY AMONGST THE INSANITY…

It’s hot in lots of places. Get over it. It’s August.
By the end of the month it will cool down. And by December it will be cold. This is Canada.
The current heat wave is not a sign of global warming. It’s a sign it’s summer.
In June, it was cooler than normal in lots of the places that are now so hot. How come the climate alarmists weren’t running around then flailing their arms in the air and shrieking about a coming ice age?
There were breathless stories in Calgary this week warning the city was in for its hottest four days in 35 years – more proof that Earth stands poised on the brink of a climate catastrophe.
Yet, if this time the cause is climate change, what caused the heatwave 35 years ago?
Couldn’t have been SUVs, pipelines or the oilsands.
Read on…
GUNTER – The current heat wave? It’s summer not global warming | Toronto Sun
*
HEAT SELLS!
CLIMATE alarmists openly admit their propaganda techniques to con you into belief…

*
SEE also :
GLOBAL TEMPERATURE MEASUREMENTS – JUDGE FOR YOURSELF!

HOTTEST YEAR EVAHH : Fourth-Warmest Year on Record? The Devil’s in the Details
Posted: August 1, 2018 Filed under: Alarmism Debunked, Alarmist media, Arctic, Climate science, Climatism, Fact Check, Global Temperature, Government Grants/Funding, Govt Climate Agenda, Green Agenda, groupthink, Politics, Propaganda | Tags: antarctic, arctic, CAGW, Climate alarmism, Climate Change, Climate marketing, Climate science, Climatism, Fact Check, Global Temperature, Global Warming, Hottest Year Ever, Joe Bastardi, Mainstream media, Media, NCEP, propaganda, science, Weatherbell Leave a comment
“A man does not sin by commission only, but often by omission.”
―Marcus Aurelius
“Deception by an omission of the truth is as bad as a lie.”
― Jennifer Chiaverini
*
CLAIMS of the “hottest year ever” tell us more about climate change marketing and PR than they do, actual science.
IN our schizophrenic, 24 hour news cycle and the era of internet clickbait, it serves the Climate Crisis Industry and those invested in man-made climate alarmism to produce headlines of “the hottest year ever” in order to push their political and ideological agenda…
THE Guardian’s Dana Nuttercelli is no stranger to pushing the ideological wheelbarrow of “hottest year evahh” hysteria…

*
THANK god for old-school meteorologists like Weatherbell’s Joe Bastardi, who cut through the cheap, lazy, clickbait alarmism to provide a scientific understanding of what really makes up “hottest year ever” claims such that we can use this knowledge to better predict weather and climate, rather than simply feeding the global warming hysteria beast for political, moral and financial gains.
BIG Joe dissects the “hottest year” meme in a great piece out of the The Patriot Post that shows the devil really is in the detail …
*
Fourth-Warmest Year on Record? The Devil’s in the Details
Joe Bastardi · Jul. 30, 2018
I continue to examine the idea that relatively minute increases in water vapor brought on by cyclically warmed oceans are the reason for the earth’s warming. But the way warming is portrayed must be looked at closely. It is very real and adds to forecast problems, but as far as the hysteria you see whipped up in relation to mankind’s self-destructing, it’s just that to me — hysteria.
Let’s assume 2018 is the fourth-warmest on record. Most people live between 70°N and 70°S.

NCEP Temp Anomaly
DISGRACE : Shameless Link Between Suicide And Climate Change, Circulating The Mainstream Media’s Echo Chamber
Posted: July 24, 2018 Filed under: Alarmism, Alarmism uncovered, Alarmist media, Alarmist Predictions, Climatism, Cult Science, Dud predictions, Eco-Activists, Failed Climate Models, Green Agenda, groupthink, Pal-Review, Propaganda, Pseudo-Science | Tags: Alarmism Exposed, Beyond Blue, climate, Climate Change, Climate Change Alarmsim, CMIP5, CNN, Echo Chamber, Extreme weather, failed climate models, Failed CMIP5 Models, Fake News, Global Temperature, Global Warming, Global Warming Alarmism, groupthink, Heatwave, Mainstream media, Mental Health, Mexico, nature journal, Pal-Review, propaganda, pseudoscience, RCP8.5, Social media, Suicide, UN, UN IPCC, United States Leave a comment
SINCE Climatism reported on the lazy and disrespectful link between suicide and climate change two days ago, a study has now surfaced out of the warmist, Nature Climate Change…

*
NOT surprisingly, the mainstream media has jumped all over this single study like a pack of hungry wolves, in a blatant attempt to link their emotionally-charged climate change cause with the genuinely emotional and tragic issue of suicide.
“The study, published today in the journal Nature Climate Change, concluded that projected temperature increases over the next few decades could lead to an additional 21,000 suicides in the United States and Mexico by 2050.”
Warming climate will likely boost suicide rates worldwide | Berkeley News
*
YET another study using the widely criticised UN IPCC CMIP5 climate models that do not accord with the stubborn observed reality of the current and inconvenient ~20 year global warming “pause”…
CURRENT UN CMIP5 CLIMATE MODEL PREDICTIONS Vs TEMPS

See : 100% Of Climate Models Prove that 97% of Climate Scientists Were Wrong! | Climatism
*
THE STUDY
PUBLISHED yesterday in the warmist journal, Nature climate change…

*
THE studies “could, maybe, might” findings are based on the highest emissions scenario, RCP8.5, pushed out to the arbitrary, unaccountable and ‘sciencey’ date of 2050…
“We project that unmitigated climate change (RCP8.5) could result in a combined 9–40 thousand additional suicides (95% confidence interval) across the United States and Mexico by 2050, representing a change in suicide rates comparable to the estimated impact of economic recessions, suicide prevention programmes or gun restriction laws.”
THE study also took into account seasonal variation, levels of poverty, the news of celebrity suicides and even depressive social media commentary that can lead to more death…
“Analysis of depressive language in >600 million social media updates further suggests that mental well-being deteriorates during warmer periods.”
Higher temperatures increase suicide rates in the United States and Mexico | Nature Climate Change
*
THE MAINSTREAM MEDIA ECHO CHAMBER…
WHAT level of responsibility is the mainstream media itself willing to accept for stoking “global warming” fears – flogging every heatwave or extreme weather event leading to the collective mass hysteria played out on social media?


Recent Comments