
BEAUTIFUL Example Of How Government Climate Agencies LIE To You About “Sea-Level Rise”
Posted: July 22, 2017 Filed under: Alarmism Debunked, Alarmism uncovered, Climatism, Empirical Evidence, Fact Check, Government Grants/Funding, Govt Climate Agenda, Green Agenda, Scientific Fraud, Sea Level Rise | Tags: Climate Change, Climate Change Hoax, Fact Check, Global Warming Hoax, Government Climate Agenda, sea level rise, Sea Level Rise Scam 2 Comments
EXCELLENT example via Paul Homewood of how Government climate agencies blatantly lie to you about climate.
Keep in mind, this is a “Government” document. And its a blatant alarmist lie.
YET another example why even Government institutions – sadly – cannot be trusted on telling you the truth on anything global warming climate change…

https://www.gov.uk/government/publications/uk-climate-change-risk-assessment-2017
According to the Government’s latest UK Climate Change Risk Assessment, sea levels around the UK are rising by around 3mm a year.

This is an outright lie.
The Committee on Climate Change also tell us in their Climate Change Risk Assessment Evidence Report, used as the basis for the Government report:

Thus implying that the rate of sea level rise has been accelerating recently.
Tide gauges however tell a totally different story.
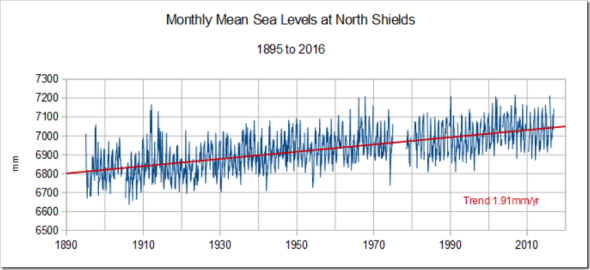
Long running sea level data is available at two sites in the UK, North Shields in the North East, and Newlyn in the South West. There is consequently a good geographic distribution, with the former on the North Sea coast, and Newlyn facing the Atlantic.
Data kept by PSMSL shows the following:

http://www.psmsl.org/data/obtaining/stations/202.php
Long term trends are around 1.9mm/yr, and it is immediately evident that there has been no acceleration in recent years.
But we can double check this by looking at the rate of rise. Below are charts showing the amount of sea level rise measured over 120-month intervals. The red line is the mean.
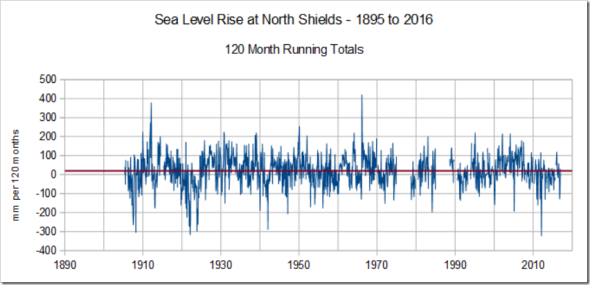

It is clear that there is no apparent trend, simply large variations throughout both records.
NOAA also publish graphs giving longer term 50-year trends. These both show that sea levels were rising faster around the mid 20thC.

https://tidesandcurrents.noaa.gov/sltrends/global_50yr.htm?stnid=170-053

https://tidesandcurrents.noaa.gov/sltrends/global_50yr.htm?stnid=170-161
There is one other long running tidal gauge record. This is at Aberdeen, although data for 2016 has not yet been entered by PSMSL.
However, NOAA show that sea levels are only rising by 0.72mm there, due to the fact that the land is rising.

https://tidesandcurrents.noaa.gov/sltrends/sltrends_global_station.htm?stnid=170-011
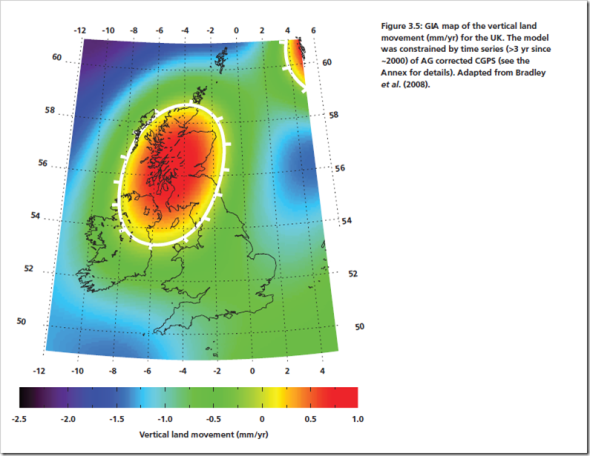
Although the land is rising in Scotland, most of England is sinking. Both are as a result of glacial isostatic adjustment, the ongoing movement of land once burdened by ice-age glaciers.
Consequently, part of the sea level rise seen at North Shields and Newlyn is due to this, rather than absolute sea level rise.
https://notalotofpeopleknowthat.wordpress.com/2017/01/28/uk-climate-change-risk-assessment-2017/
Threats of ever rising sea levels are stock in trade for the climate mafia, yet when we look at actual tidal gauge records, we see nothing other than a gradual rise, going back to the 19thC.
However, for such fake claims to be made in an official government report is simply unacceptable.
•••
Sea-Level Rise Scam Related :
- NASA “Sea Level Rise” Fraud | Climatism
- Miami’s Vice | Climatism
- Tangier Island | Climatism
- Falling Sea Level: The Critical Factor in 2016 Great Barrier Reef Bleaching! | Climatism
Sea Level Rise Fraud Related :
- 44th Pacific “Sinking Islands” Extortion Forum (COP21 Update 2015) | Climatism
- Climate Change Sea Level Rise Extortion | Climatism
- It wasn’t CO2: Global sea levels started rising before 1800 « JoNova
- NASA Sea Level Fraud | Real Science
Mainstream Media Sea Level Rise Alarmism :
- L.A. Times climate science denial article instead shows the Times clearly denying well established climate science | Climatism
- National Geographic’s Junk Science: How long will it take for sea level rise to reach midway up the Statue of Liberty? | Climatism
Sea Level Rise Related :
- Rate of global sea level rise decelerating this century
- No Sea Level Rise Along The Western Coast Of North America Since The Start Of Satellite Records
- Scientists Find That Sea Level Rise Is Much Slower Than Expected…No Human Fingerprint
- Global Sea Level Trend – 1.08 mm/year – NOAA records
- NEW PAPER : The global mean sea level started decelerated rising since 2004 with the rising rate 1.8 ± 0.9 mm/yr in 2012.
- NEW PAPER : Sea level rise slowed from 2004 – Deceleration, not acceleration as CO2 rises.
- NEW PAPER : New paper finds global sea levels rising at only 7 inches per century or 1.5mm/yr – THE HOCKEY SCHTICK
- Pacific Island Nations Are Growing Not Sinking
- The Maldives Are Not ‘Sinking’, They Are In Fact ‘Growing’


[…] ~ For once, Nye is actually telling the truth; we “older” folks haven’t been brain-washed by today’s public indoctrination centers. We grew up when science was still based in reality […]
LikeLike
[…] BEAUTIFUL Example Of How Government Climate Agencies LIE To You About “Sea-Level Rise” | Climati… […]
LikeLike