“I am a skeptic…Global warming has become a new religion.” – Nobel Prize Winner for Physics, Ivar Giaever.
Warming fears are the “worst scientific scandal in the history…When people come to know what the truth is, they will feel deceived by science and scientists.” – UN IPCC Japanese Scientist Dr. Kiminori Itoh, an award-winning PhD environmental physical chemist.
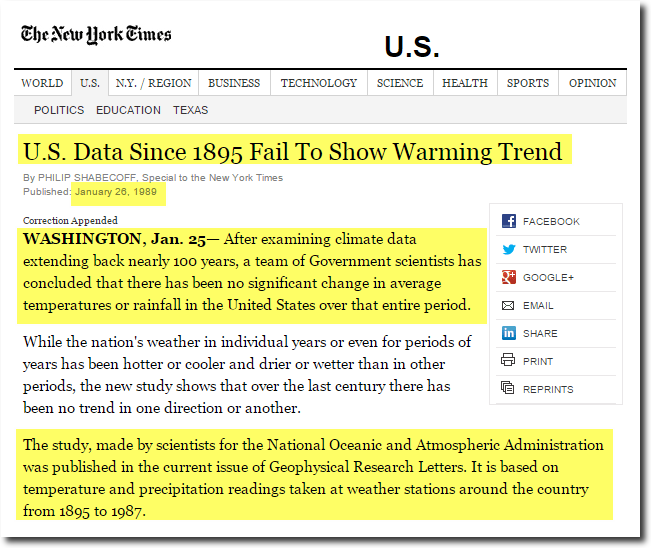
ANOTHER week, another dose of political correctness gone mad as CBC radio pulled the Christmas classic from their line-up claiming that the 1940s holiday song promotes rape culture.
THAT’s not the only thing that the PC brigade and their climate comrades would probably like to pull from the records …
IT’s not even winter yet in the Northern Hemisphere, and we’ve already witnessed a multitude of record cold events set :
1980 was an anomalously high (sea ice extent) year
– Walt Meier NSIDC
Claims that Arctic sea ice is disappearing are patently false. There has been no trend in Arctic sea ice extent since the start of MASIE records in 2006.
Snowfall will become “a very rare and exciting event.”
“Children just aren’t going to know what snow is.” Dr David Viner – Senior scientist, climatic research unit (CRU)
•••
THE planet’s “climate control knob” – CO2 – dumps a load of fresh global warming on the South African Savannah.
THE Guardian reports with no mention of “CLIMATE CHANGE”!?
ALAS, every organisation has rules and a code of conduct. The Guardian’s is easy…
HOT = CLIMATE
COLD = WEATHER
Spotted: giraffes in the snow
Antelope, rhinoceroses and elephants also photographed in icy conditions after late snowfall in South Africa
Giraffes in the snow in the Karoo region of South Africa. Photograph: Kitty Viljoen
Animals more used to desert heat have been photographed enjoying the snow after a cold front brought snowfall to parts of South Africa over the weekend.
Giraffes, antelope, rhinoceroses and elephants were photographed in icy conditions around South Africa, in pictures shared widely on social media.
FacebookTwitterPinterest Antelope on the Glen Harry Game reserve in Graaff-Reinet, Eastern Cape. Photograph: Katjana Hoskin Ott/Snow Report SA
Kitty Viljoen captured elephants enjoying the snow in the Sneeuberg – which translates to Snow Mountain – on the Western Cape of South Africa, where snow set in late last week. She also photographed giraffes in snow in the Karoo semi-desert region.
Antelope on the Glen Harry Game reserve in Graaff-Reinet, Eastern Cape, were also pictured surrounded by icy vegetation.
Snowfall across parts of South Africa late last week prompted the department of transport to close roads across the Eastern Cape due to slippery conditions.
The snow also hit the Western Cape, where temperatures dropped below zero across parts of Cederberg, the Hex River Mountains and the Matroosberg Reserve.
FacebookTwitterPinterest A cold front in South Africa last week saw snow fall across parts of the country. Photograph: Kitty Viljoen
A weather forecast for the weekend, produced by Snow Report South Africa, shows snowfalls in the Northern, Western and Eastern Cape, as well as in the state of Kwazulu-Natal, with some areas receiving more than 25cm of snow across three days.
Lesotho, which is an independent country surrounded by South Africa, was due to receive the heaviest covering of snow, with roughly two-thirds of the country predicted to receive snowfall.
Snowfalls are not infrequent across parts of South Africa during the winter, though this cold snap comes late in the season. In July, parts of the country were blanketed after several days of heavy snowfall.
Warming fears are the “worst scientific scandal in the history…When people come to know what the truth is, they will feel deceived by science and scientists.” – UN IPCC Japanese Scientist Dr. Kiminori Itoh, an award-winning PhD environmental physical chemist.
“It is a blatant lie put forth in the media that makes it seem there is only a fringe of scientists who don’t buy into anthropogenic global warming.” – U.S Government
Atmospheric Scientist Stanley B. Goldenbergof the Hurricane Research Division of NOAA.
“I am a skeptic…Global warming has become a new religion.” – Nobel Prize Winner for Physics, Ivar Giaever.
•••
LOWER troposphere global temperatures continue their decline off the 2015/16 Super El Niño highs.
AUGUST temps plunged off the July bump of +0.32 deg. C, cooling back to +0.19 deg. C above the long-term average.
THE August anomaly drop brings global temps back to 2002 levels…
A global wave of “Extreme Media” followed the purported “Global Heatwave” of late July/early August that had the climate ambulance chasing, global warming theory-obsessed media in hysterics…
It’s hot in lots of places. Get over it. It’s August.
By the end of the month it will cool down. And by December it will be cold. This is Canada.
The current heat wave is not a sign of global warming. It’s a sign it’s summer.
In June, it was cooler than normal in lots of the places that are now so hot. How come the climate alarmists weren’t running around then flailing their arms in the air and shrieking about a coming ice age?
There were breathless stories in Calgary this week warning the city was in for its hottest four days in 35 years – more proof that Earth stands poised on the brink of a climate catastrophe.
Yet, if this time the cause is climate change, what caused the heatwave 35 years ago?
Couldn’t have been SUVs, pipelines or the oilsands.
Snowfall will become “a very rare and exciting event.”
“Children just aren’t going to know what snow is.” Dr David Viner – Senior scientist, climatic research unit (CRU)
•••
GLOBAL WARMING’s infallible wrecking ball – CO2 – brings summer snow to Europe, North America, Canada, Japan and even Saudi Arabia!
CHILDREN might be able to now ski in summer, but don’t expect to read about this in the mainstream media. They are only interested in hot weather to push their CO2-centirc, global warming agenda…
EUROPE
Heavy Summer Snowfall in European Alps – Austria, Italy, Germany & Switzerland Receive Up To 40cm
Set to open next month, Stubai Glacier (Stubaier Gletscher) has gotten in early for the first snow of the 2018/19 winter season… as it’s still summer. Image:: Stubai Glacier
Heavy snow fell above 1500 metres across the European Alps this weekend with a number of destinations reporting over 40cm of the fluffy white stuff.
While it is still summer in Europe, temperatures dropped over 15 degrees and dipped into the negatives in less than 24hrs. Germany’s highest peak, The Zugspitze – at 2962m above sea level – recorded 25cm of snow whilst thermometers hit negative 7 degrees.
Although skiing remains possible across half a dozen glacier dependant ski fields throughout Austria, Italy and Switzerland, the snowfall came just days after these areas were recording temperatures in the 10’s and 20’s, with parts of Germany expecting temperatures to reach 30 degrees by mid-week.
The result of the cold front that swept across many of these resorts and throughout Central Europe is perhaps best summed up in the below images… Feast your eyes and enjoy!
Gamskarkogelhütte auf is a mountain cabin in Bad Hofgastein, Austria. At an elevation of 2467m they got absolutely blanketed in snow! These images where taken 22hrs ago. Image:: Gamskarkogel Hütte’s Facebook
Seeing is believing! Image:: Gamskarkogel Hütte’s Facebook
It’s not often you have to dig out the front door in Europe, in August, in summer… Image:: Gamskarkogel Hütte’s Facebook
The sun came out 12hrs ago, illuminating a pretty spectacular scene. Image:: Gamskarkogel Hütte’s Facebook
A summer winter wonderland. Image:: Gamskarkogel Hütte’s Facebook
“A man does not sin by commission only, but often by omission.”
―Marcus Aurelius
“Deception by an omission of the truth is as bad as a lie.”
― Jennifer Chiaverini
*
CLAIMS of the “hottest year ever” tell us more about climate change marketing and PR than they do, actual science.
IN our schizophrenic, 24 hour news cycle and the era of internet clickbait, it serves the Climate Crisis Industry and those invested in man-made climate alarmism to produce headlines of “the hottest year ever” in order to push their political and ideological agenda…
THE Guardian’s Dana Nuttercelli is no stranger to pushing the ideological wheelbarrow of “hottest year evahh” hysteria…
THANK god for old-school meteorologists like Weatherbell’s Joe Bastardi, who cut through the cheap, lazy, clickbait alarmism to provide a scientific understanding of what really makes up “hottest year ever” claims such that we can use this knowledge to better predict weather and climate, rather than simply feeding the global warming hysteria beast for political, moral and financial gains.
BIG Joe dissects the “hottest year” meme in a great piece out of the The Patriot Post that shows the devil really is in the detail …
I continue to examine the idea that relatively minute increases in water vapor brought on by cyclically warmed oceans are the reason for the earth’s warming. But the way warming is portrayed must be looked at closely. It is very real and adds to forecast problems, but as far as the hysteria you see whipped up in relation to mankind’s self-destructing, it’s just that to me — hysteria.
Let’s assume 2018 is the fourth-warmest on record. Most people live between 70°N and 70°S.
AT the beginning of the Century we were told by Dr David Viner – fmr senior activist scientist at the UEA’s climatic research unit (CRU) – that Snowfall would become “a very rare and exciting event,” and that “Children just aren’t going to know what snow is.”
SINCE Viner’s epic fail in 2000, the global temperature dial has been stubbornly stuck on Pause, with some of the ‘snowiest’ and coldest winters on record occurring over the same period, despite record and rising CO2 emissions…
2018 has been no exception with extreme cold and record snowfalls affecting vast areas of the Northern Hemisphere with rare snow touching down in areas as far south as Southern Morocco, and the Sahara desert. We’ve even seen sharks frozen to death on the shores of Cape Cod, and Iguanas frozen solid in Florida!
ALL this happening in the years that climate activists scientists tell us are the “Hottest Evah“.
IT would appear Mother Nature is speaking a different language to that of her warmist subjects living life inside the bubble of man-made global warming hysteria!
“BEAST FROM THE EAST”
UK is currently under siege from an epic Siberian cold front dubbed the “Beast from the east”…
ANTICIPATING the negative impact the “beast from the east” might have on the global warming narrative, the mainstream media has gone into full propaganda mode churning out numerous reports dismissing the sub-zero extremes on…you guessed it, “global warming”!
THIS actual headline from The Guardian’s resident climate catastrophist, George Monbiot, particularly mind-blowing…
THE counter-claim by climate activists scientists like Vladimir Petoukhov of the Potsdam Institute is that shrinking Arctic sea ice “could triple the probability of cold winter extremes in Europe and northern Asia”. The well-orchestrated claim jumped on and circulated by the activist press…
THE other Hot-off-the-press weather event circulated by the media, in order to divert attention away from the brutal cold, has been the apparent “unprecedented” warmth in the Arctic. A claim expertly debunked by Paul Homewood in this must read post: Arctic Alarmists Hit New Records Of Hysteria | NOT A LOT OF PEOPLE KNOW THAT
MEANWHILE, as the climate mafia propagandisers inside their COLD = HOT bubble, the other conveniently forgotten pole, Antarctica, continues its long 40 year+ cooling trend, gaining ice mass despite record and rising CO2 levels and claims of “The Hottest Years Evah“…
Mass changes of the Antarctic ice sheet impact sea-level rise as climate changes, but recent rates have been uncertain. Ice, Cloud and land Elevation Satellite (ICESat) data (2003–08) show mass gains from snow accumulation exceeded discharge losses by 82 ± 25 Gt a−1, reducing global sea-level rise by 0.23 mm a−1.
Roger Tallbloke with a final word that makes a lot more sense than the pseudoscientific, HOT = COLD, bubble-world of global warming climate change activists…
The role of the lowest solar cycle for at least a century is mostly ignored by believers in man-made global warming. There are signs of climate change, but not necessarily the kind they expect.
THE “Hottest Year Ever” meme is just one in a long line of marketing techniques used by Climate Crisis Inc. to make you believe the world is burning up.
HOW much of these claims are scientific, versus, pure-propaganda designed to heighten alarm on a publicly waning issue – catastrophic anthropogenic global warming (CAGW)? A *theory* whose veracity is becoming increasingly questioned by contradictory science, real-world observations and growing public and media awareness of the disturbing trend of temperature data manipulation by our most ‘trusted’ scientific agencies.
Over and over, we are confronted with claims that last month or last year was “the warmest on record.” Each claim is accompanied by dire warnings that the alleged new records portend “unprecedented” chaos for wildlife, humans and planet.
Virtually never do these scary press releases mention:
That the supposed change is mere hundredths of a degree higher than previous measurements.
Never do they admit that the margin of error in these measurements is far greater than the supposed increase.
Never do they suggest that a little more warmth would be infinitely better than a colder world, with less arable land and shorter growing seasons.
And most certainly, never do they admit to the massive deficiencies in the system that supposedly tracks Earth’s temperature … and
Always blames any increases on humans and fossil fuels.
This article by Dr. Tim Ball and Tom Harris points out all these highly relevant but often (deliberately) ignored realities.
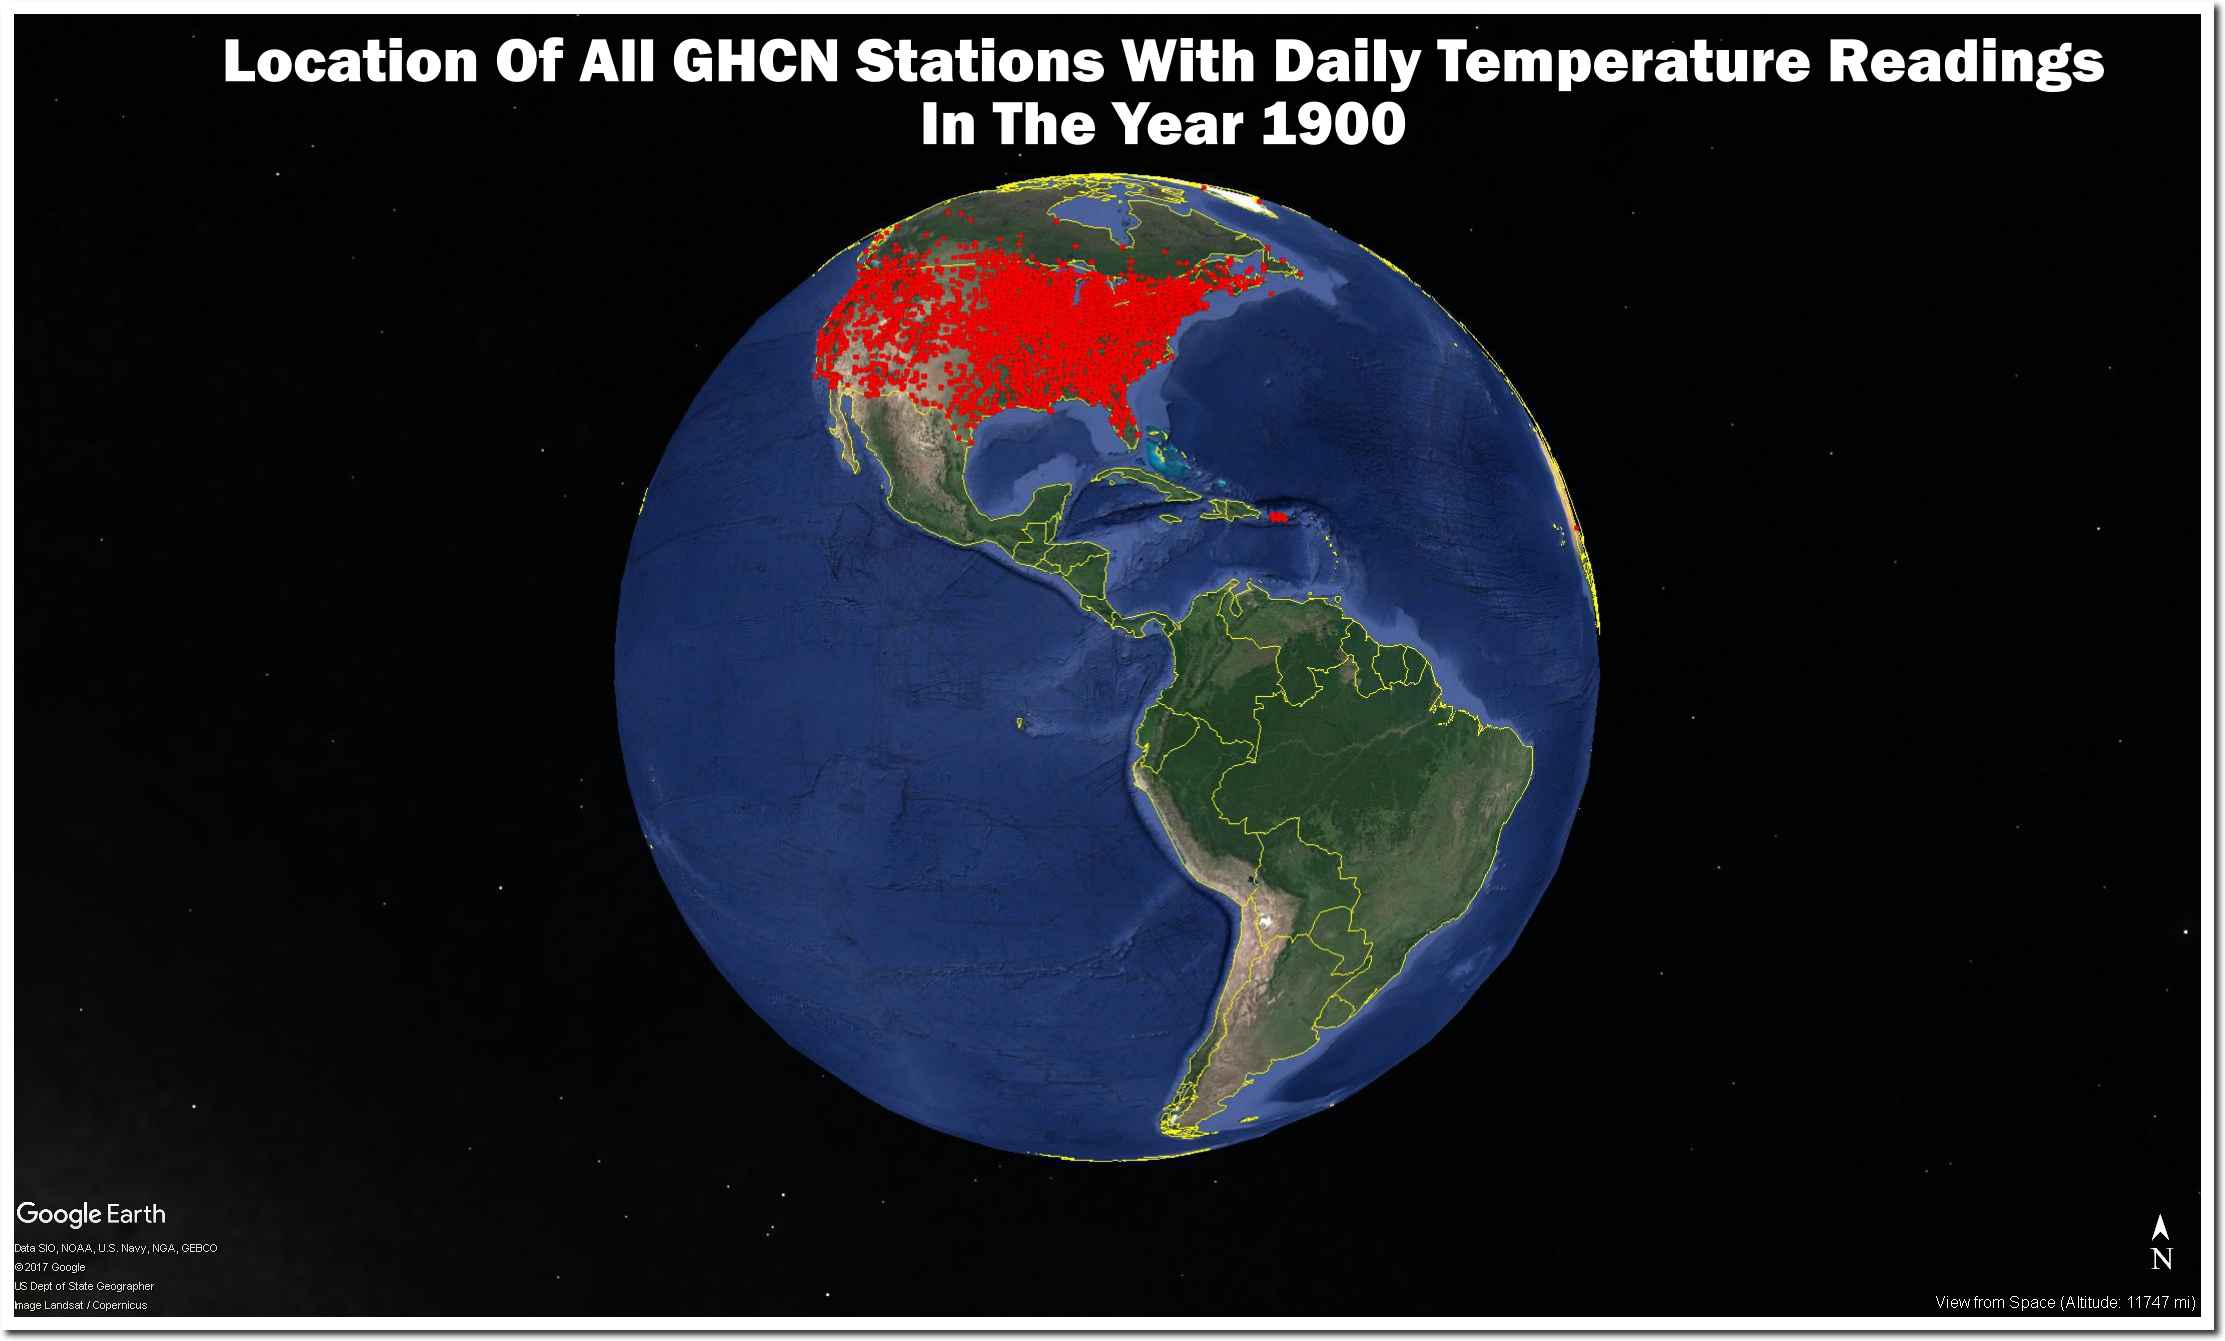
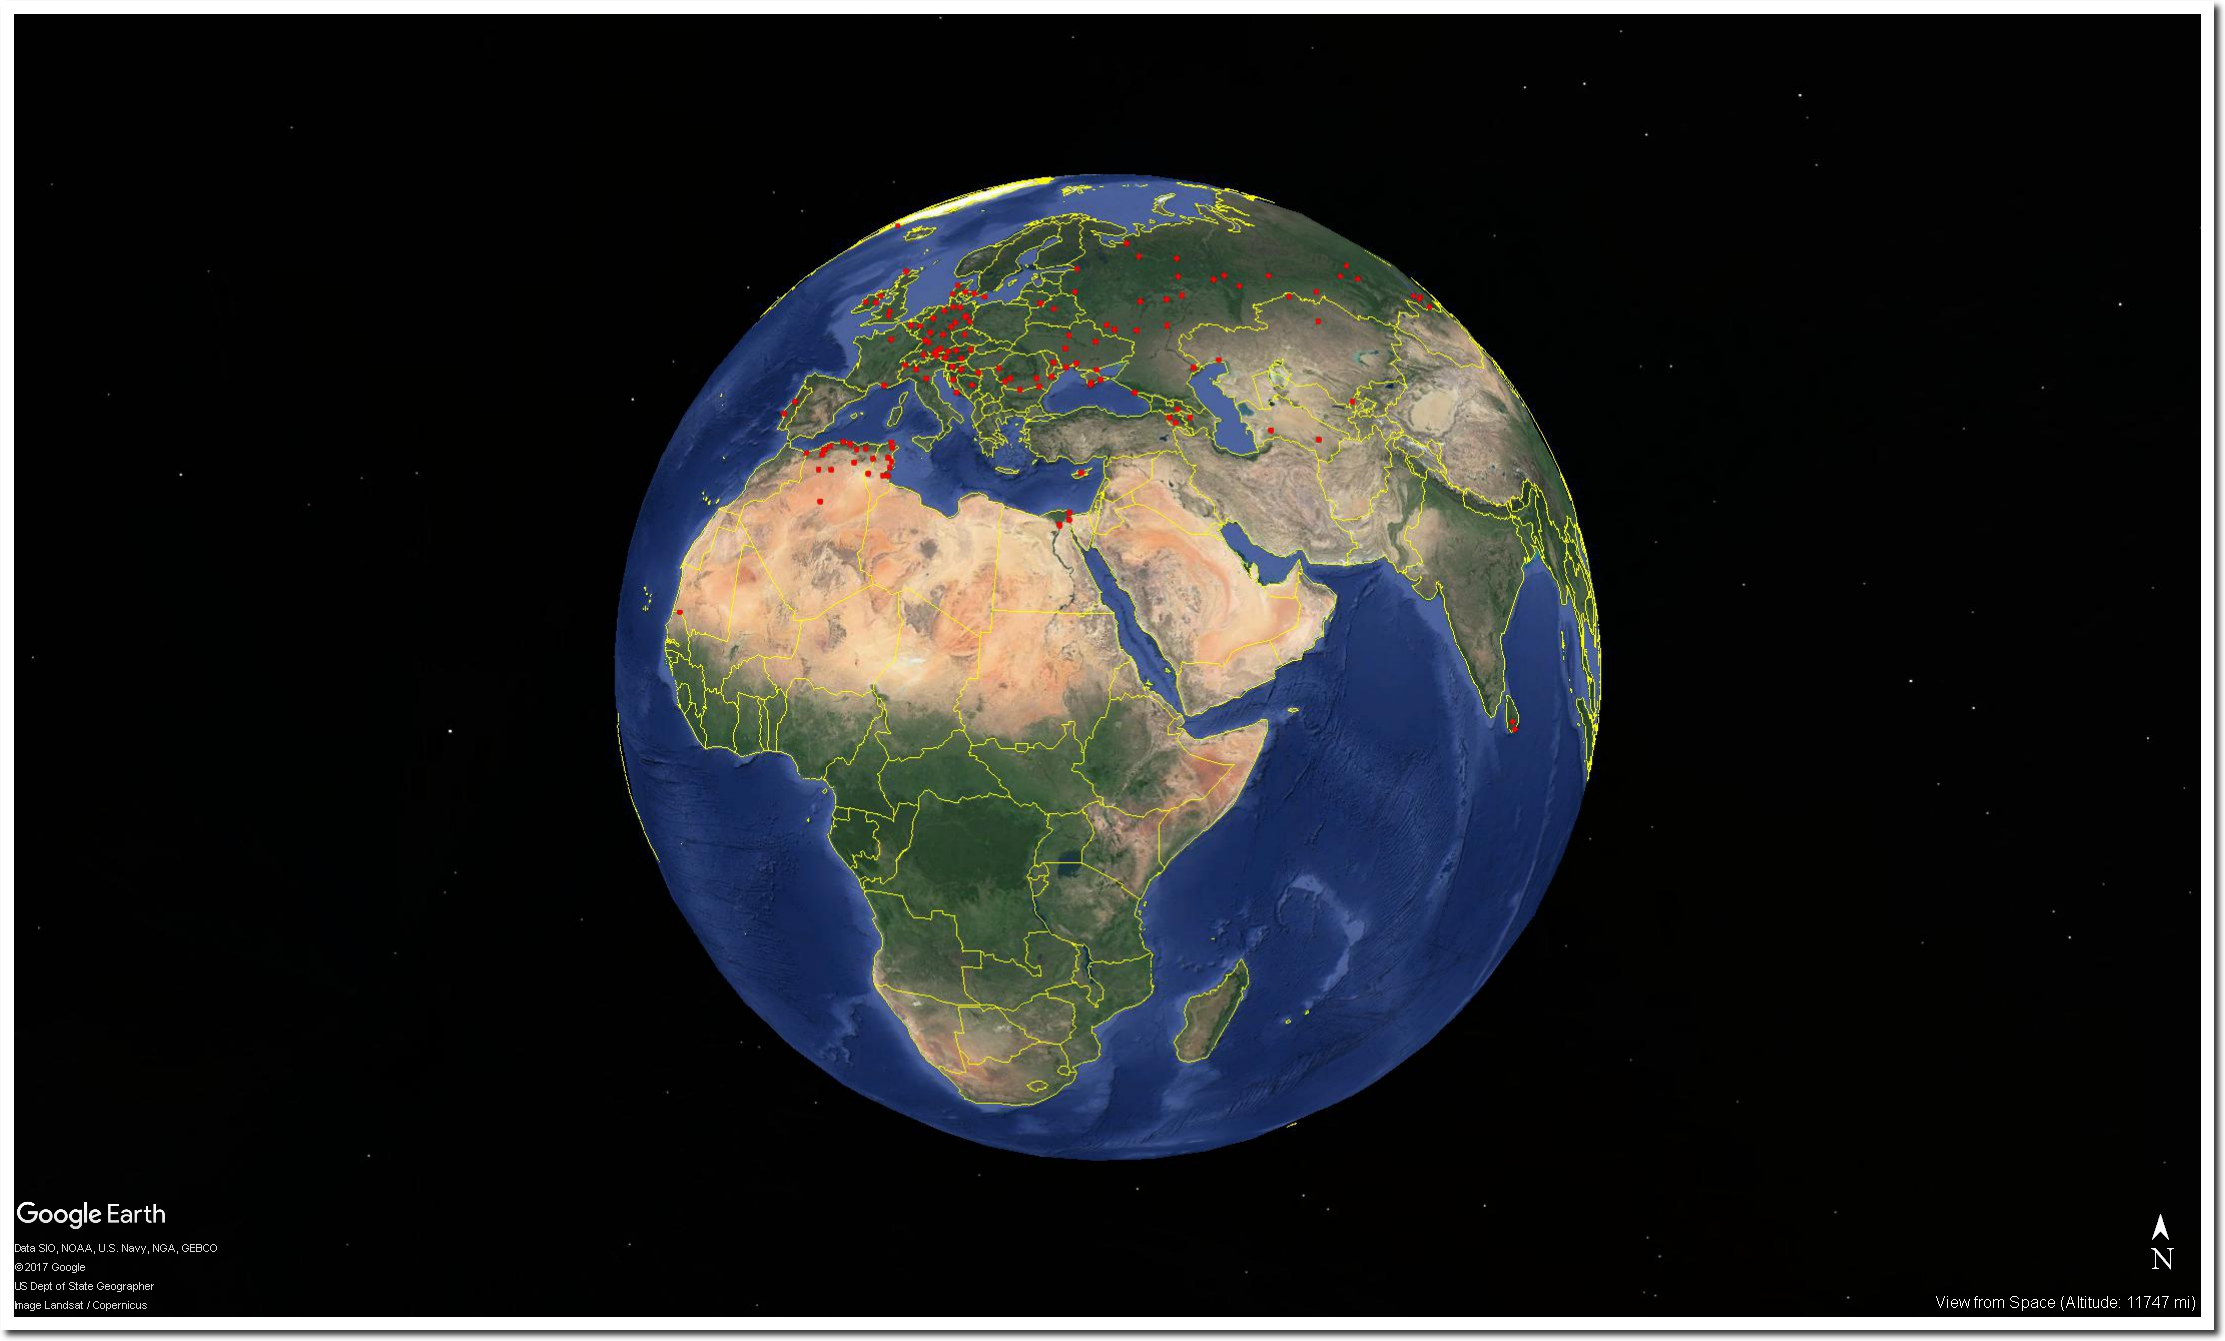
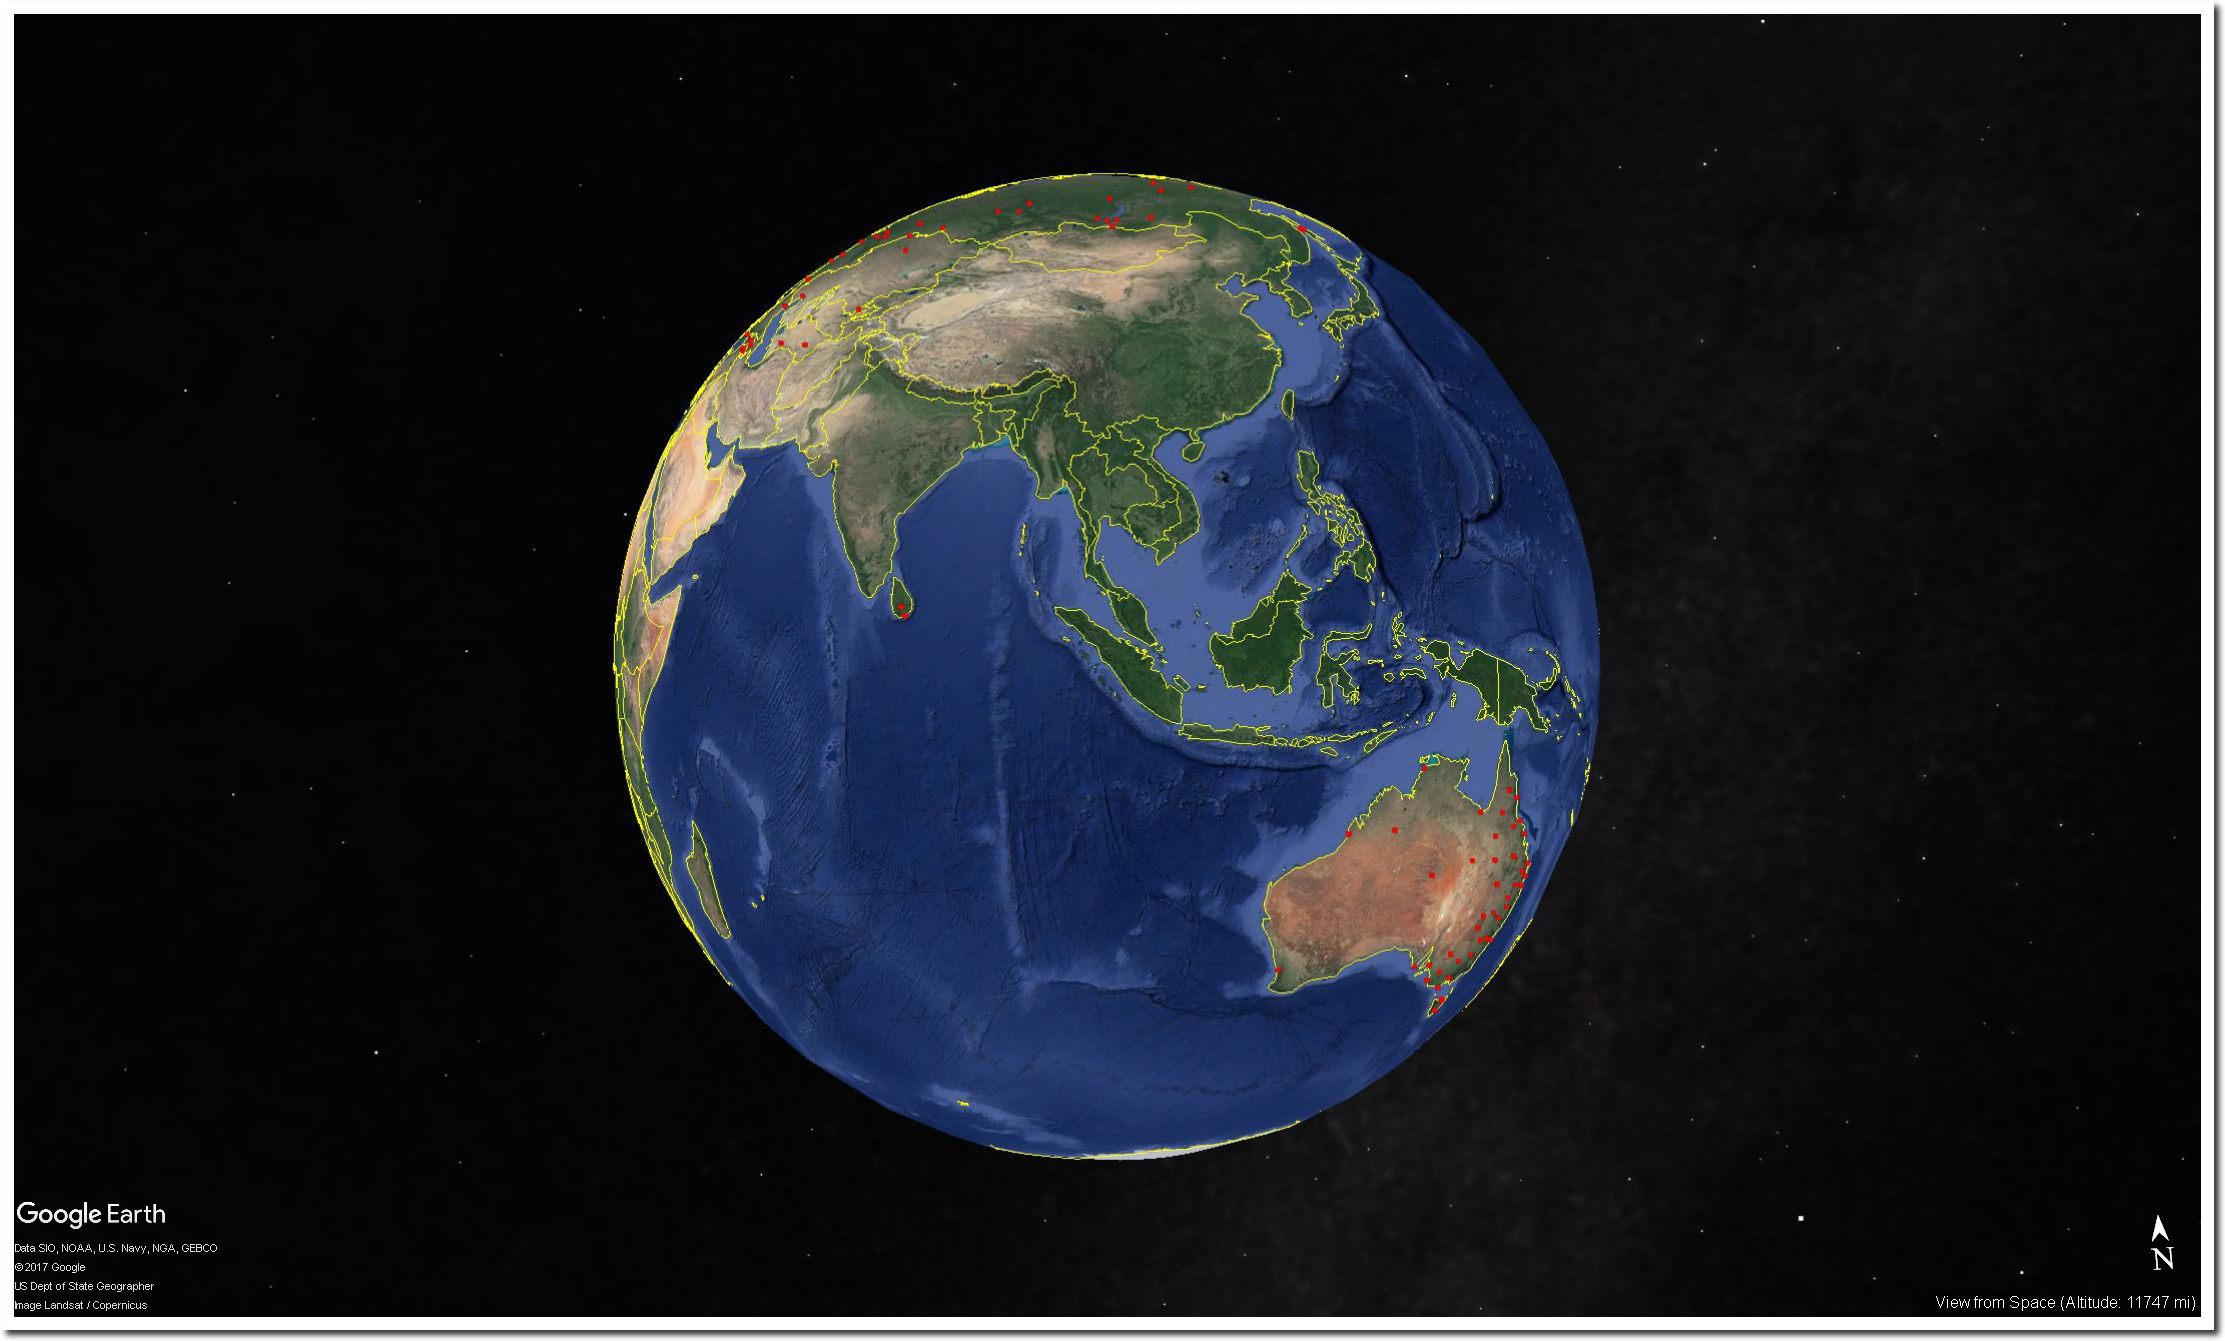
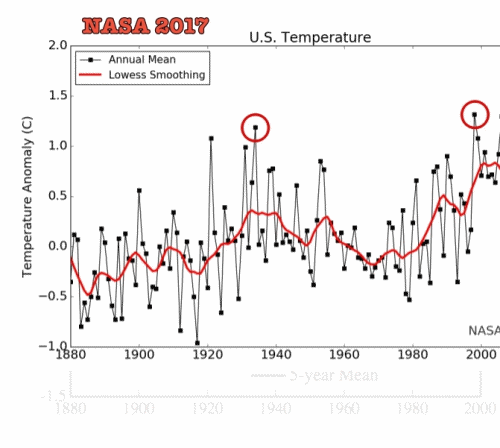
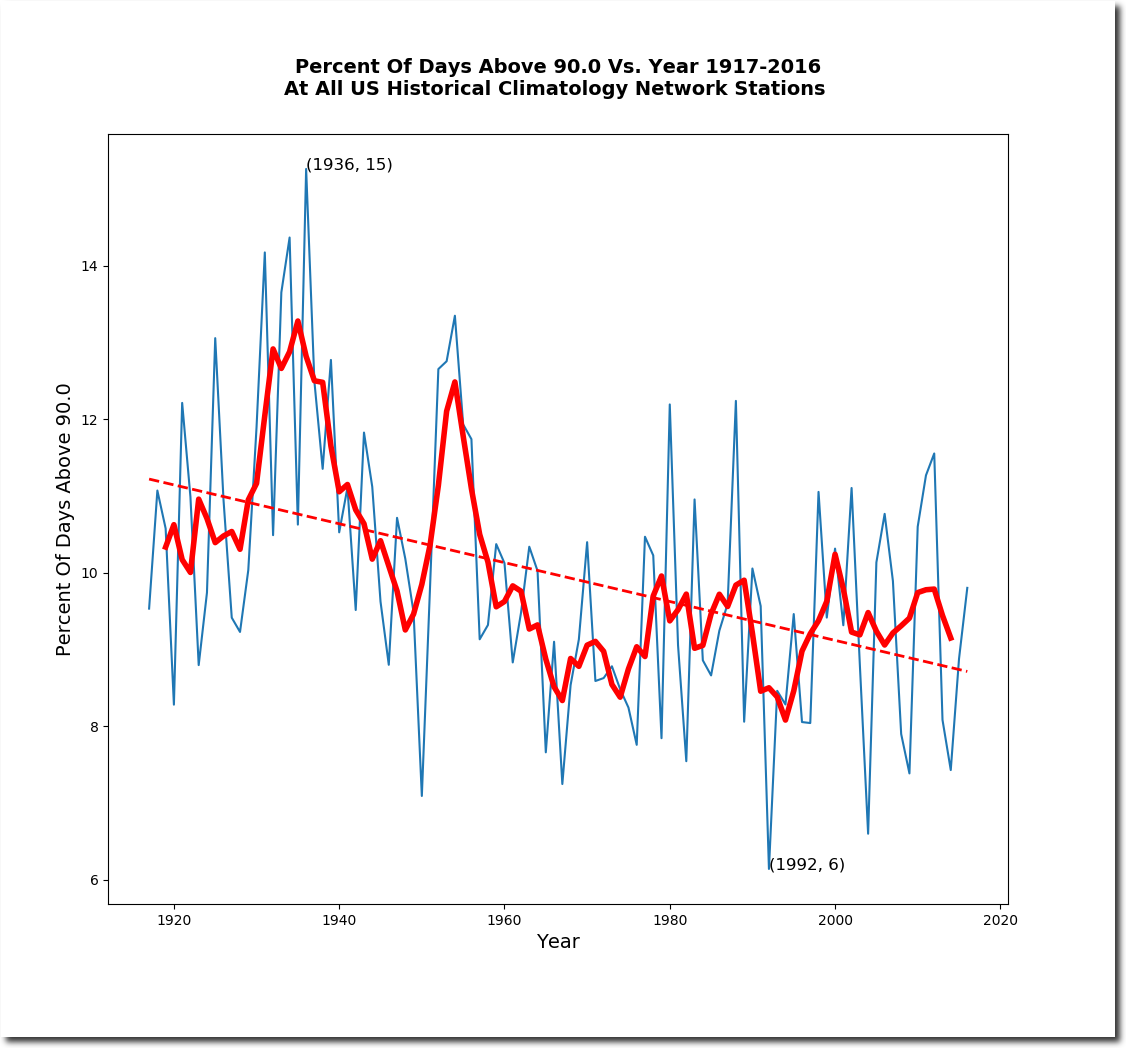
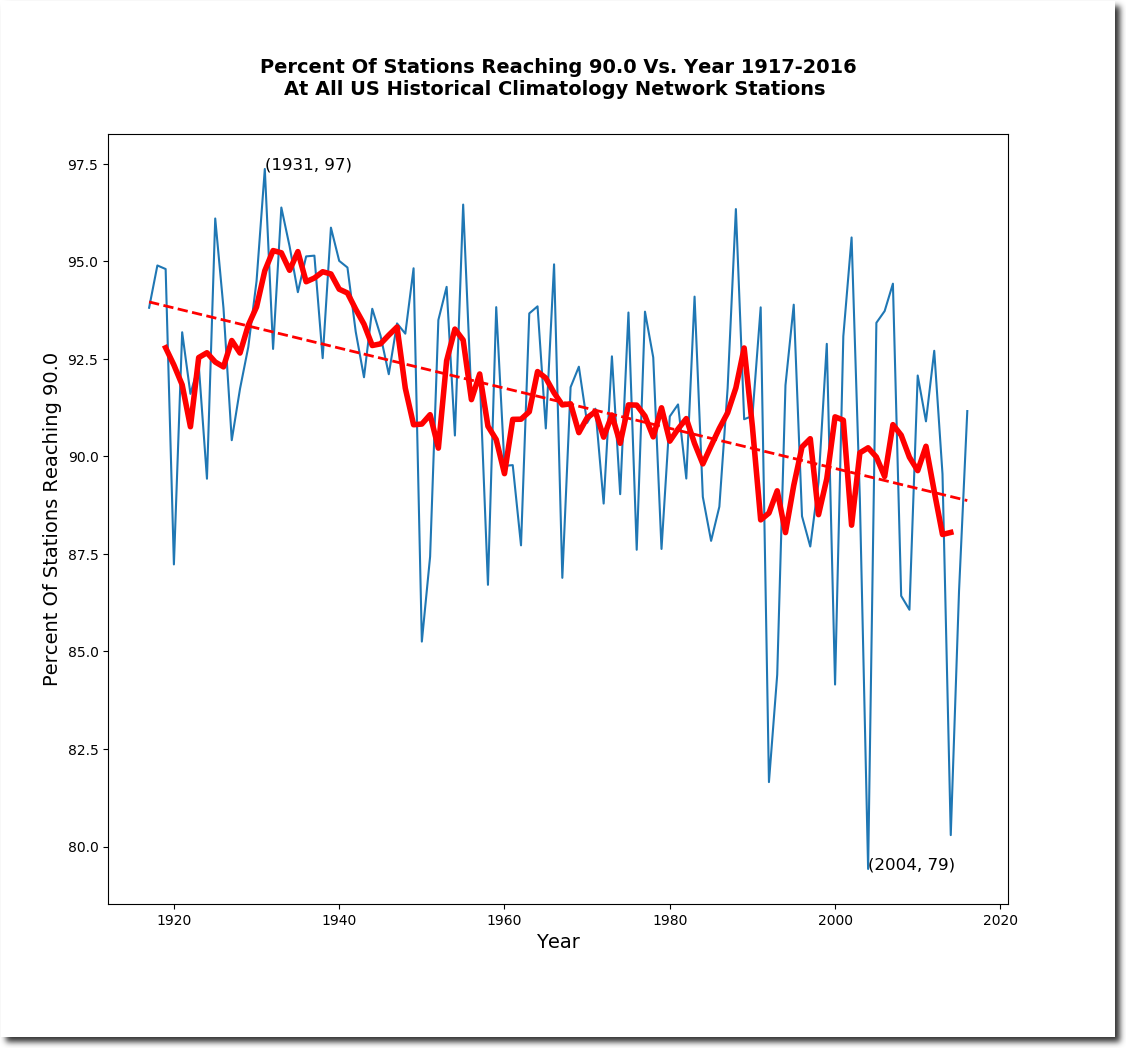
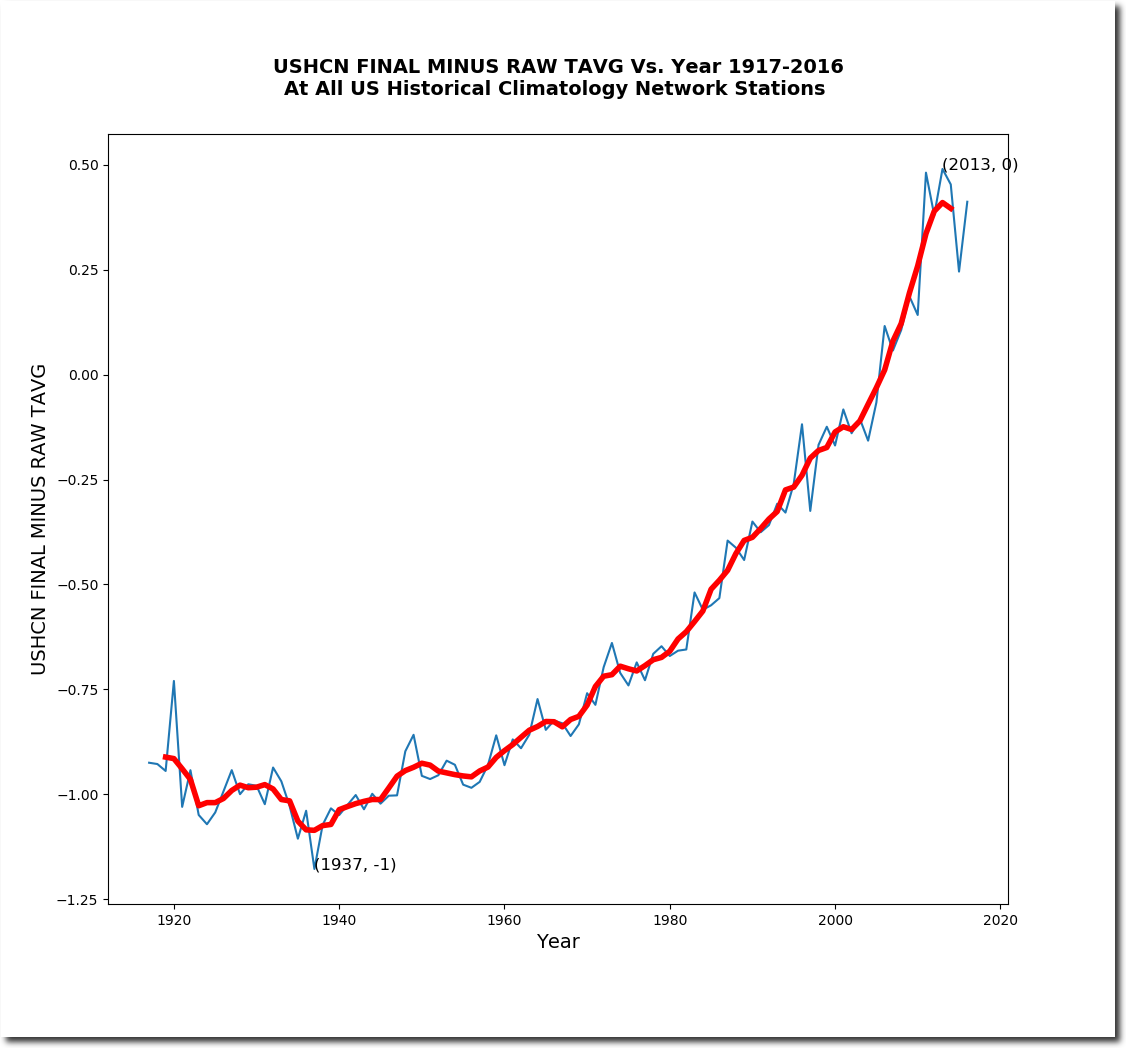
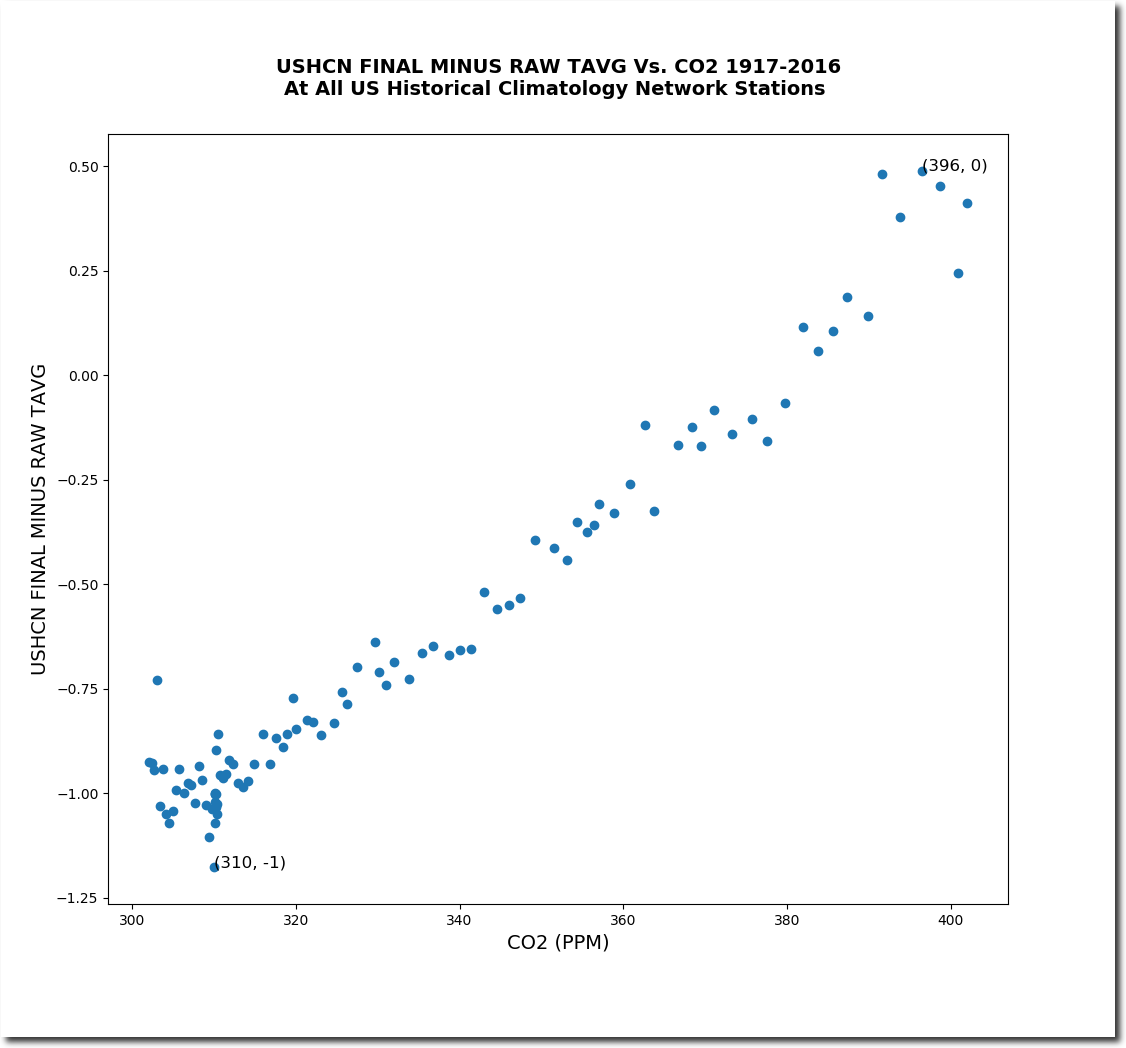
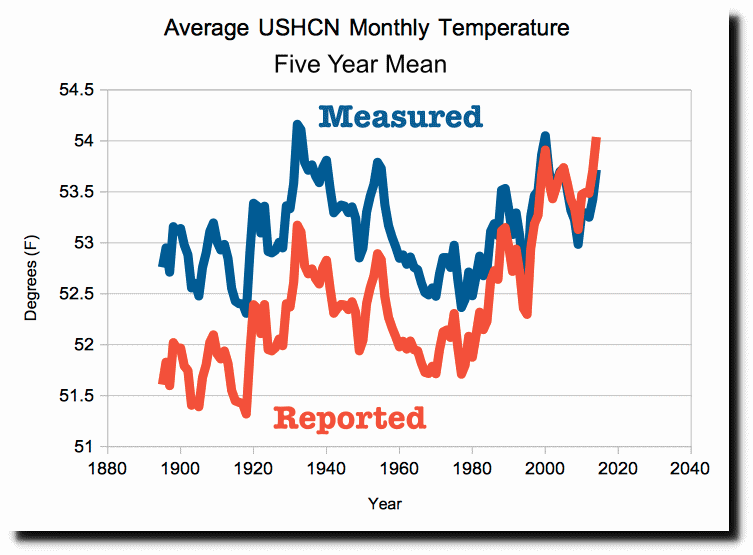
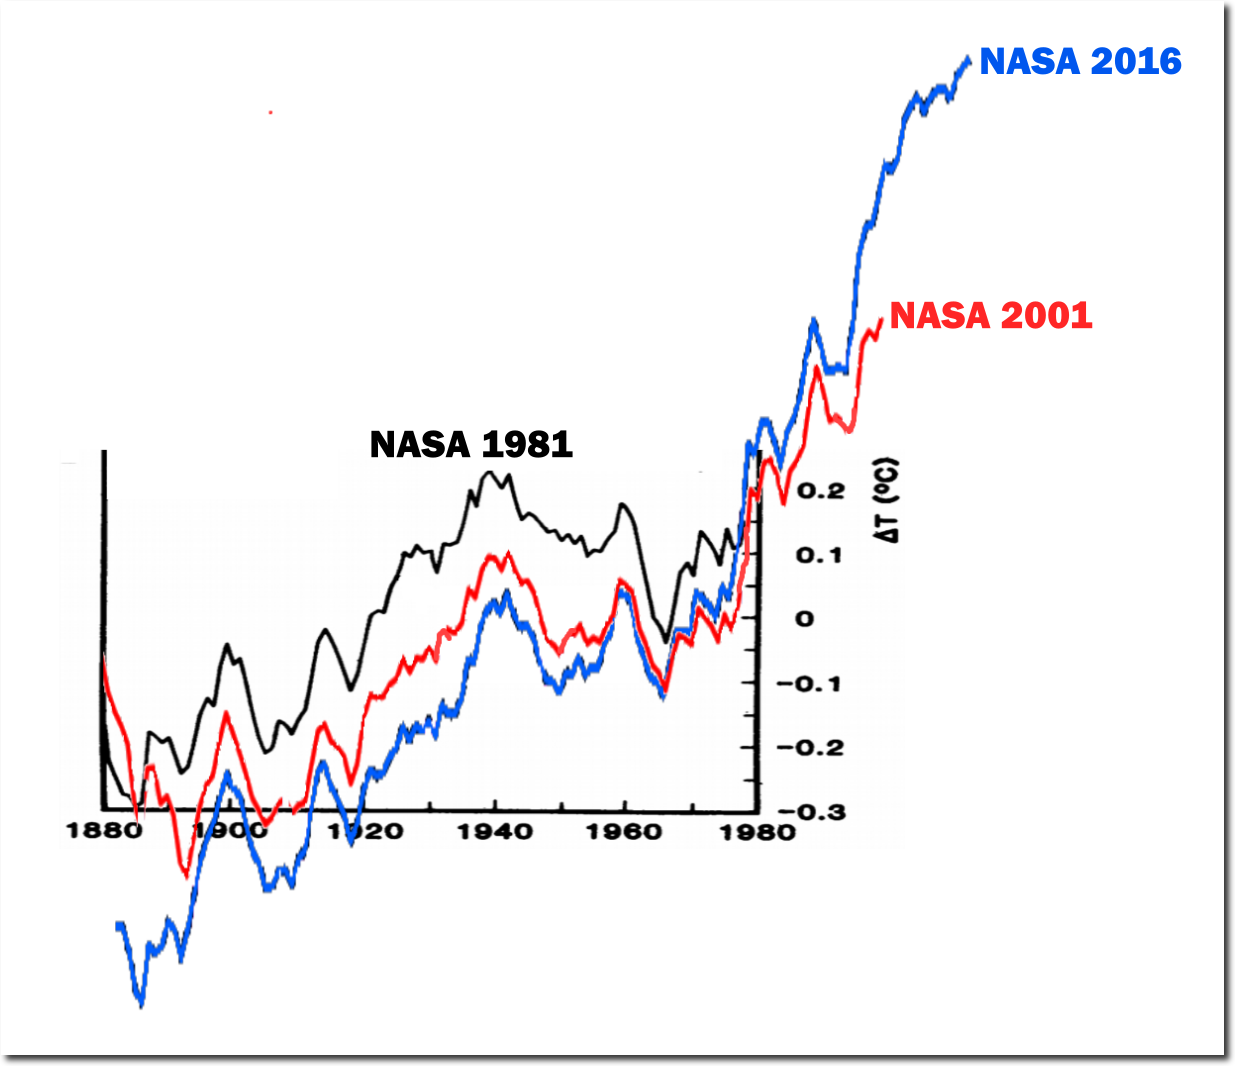
AS the old saying goes “Sunlight is said to be the best of disinfectants“. One man who has been tireless and paid-less (sic) in the pursuit of exposing the blatant and unequivocal global temperature data fraud, executed by taxpayer funded government scientific agencies worldwide, has been Tony Heller aka Steve Goddard.
THERE are literally thousands upon thousands of mind-blowing examples of temperature data manipulation/fraud carried out in-plain-sight by climate activist agencies namely – NOAA, NASA, BoM, Met Office UK – who happen to be the literal gate-keepers of global temperature. They do this simply to make you believe that the climate is warming catastrophically thanks to your carbon dioxide (energy) emissions.
THE blink giff included in this post is really all one needs to know about how climate scientists literally “change the data to fit the theory” – a quote linked to Hungarian Marxist Georg Lukacs in his ‘Tactics and Ethics’ (1923) though often associated with Albert Einstein as a non-literal quip.
OTHER than driving the climate scare and maintaining taxpayer funding to the tune of $Trillions worldwide, hysterical claims of the “hottest year, month, day ever” tell us far more about global warming climate change marketing than they do about actual ‘science’.
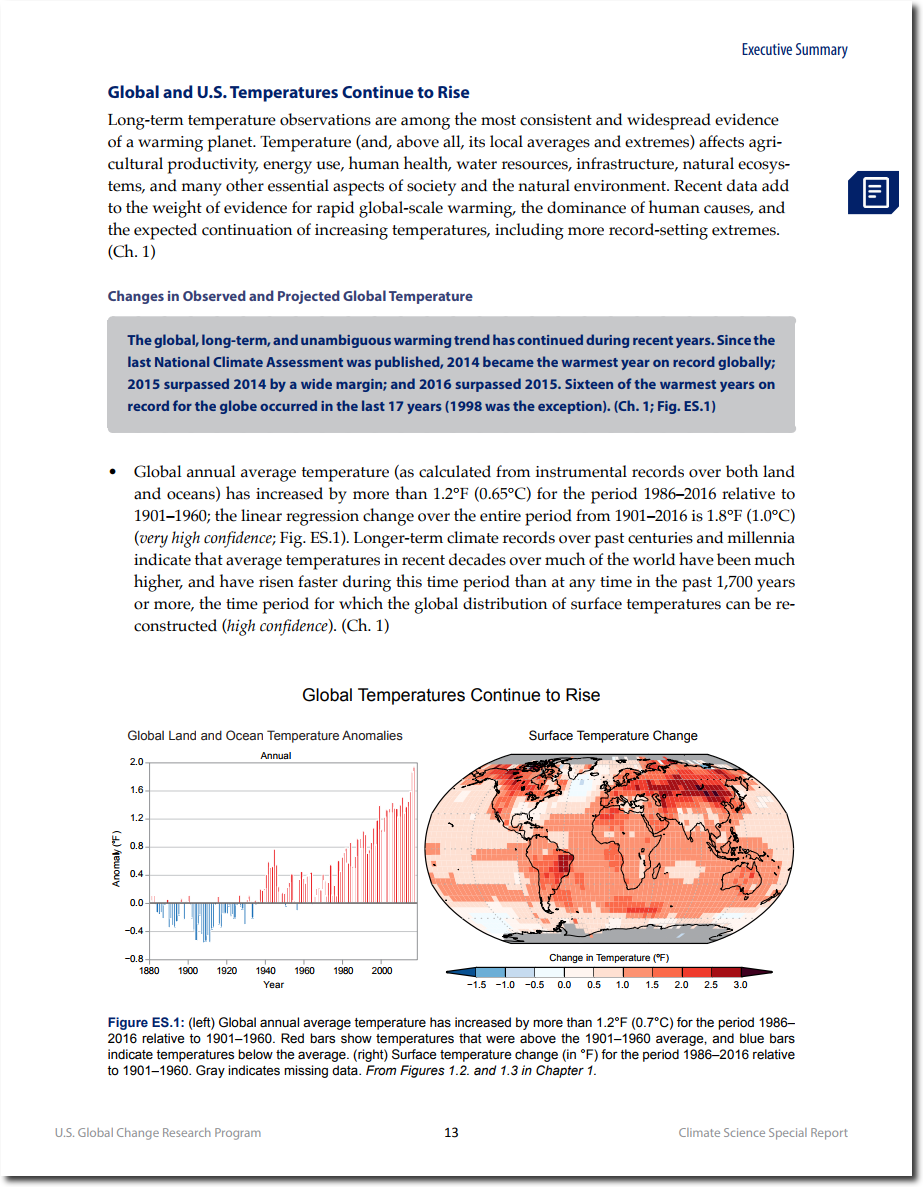
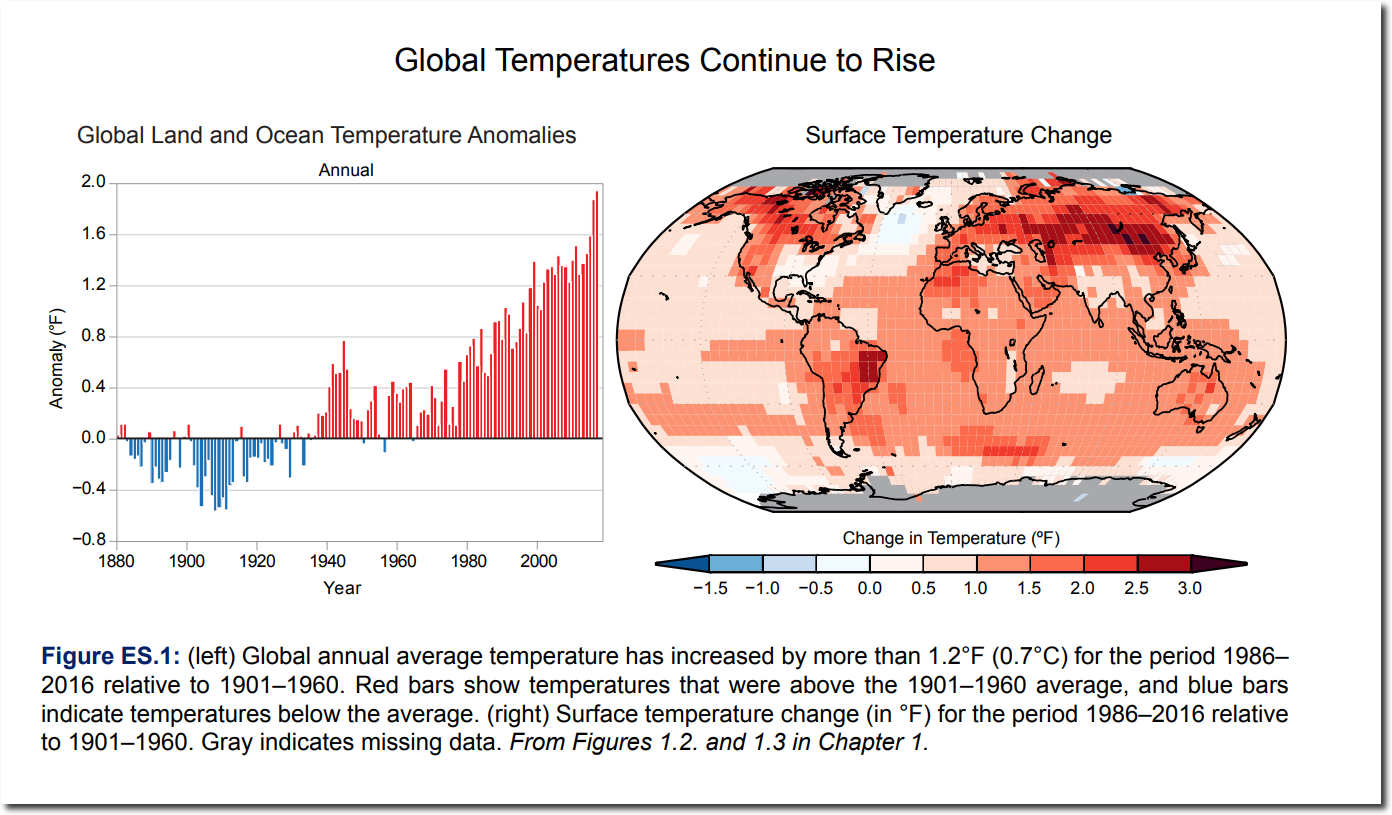
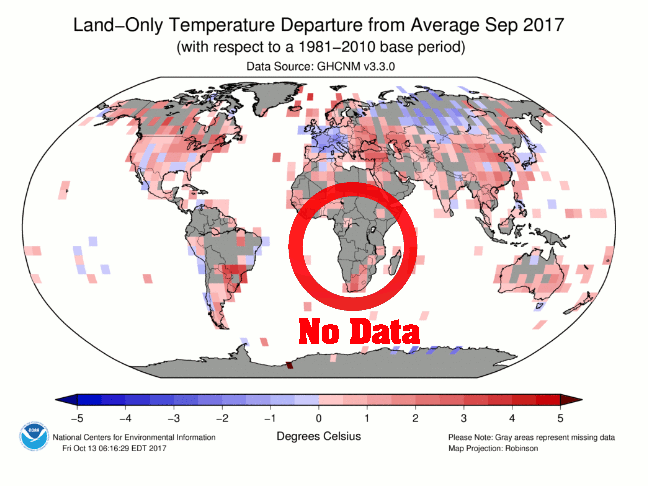
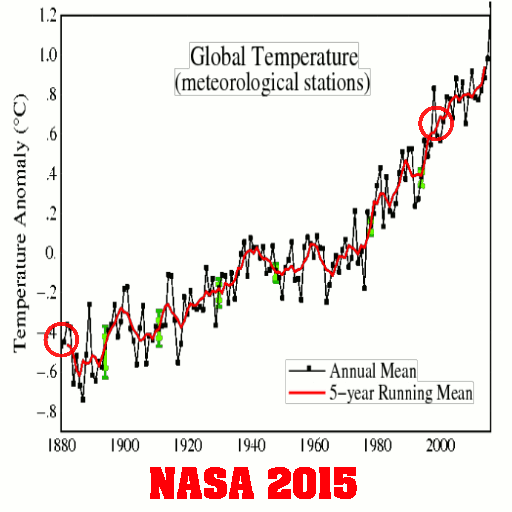
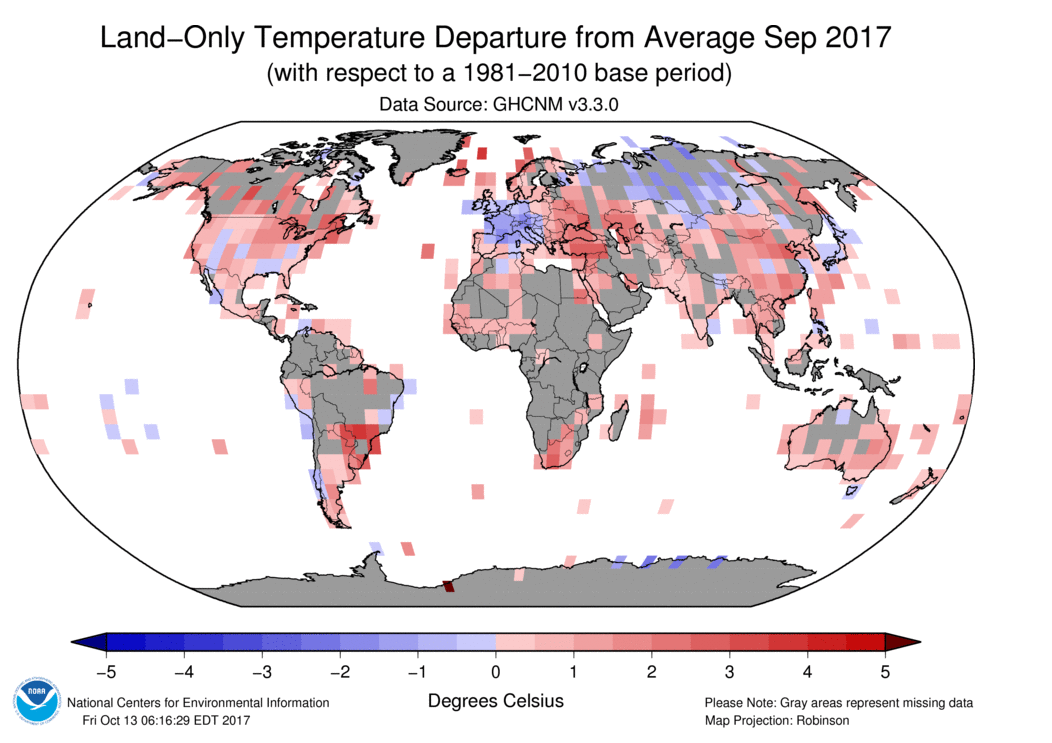
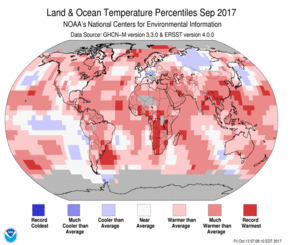
They show a very detailed graph and map which expresses the claimed warming.
All that red looks pretty scary. Red is the color of fire, and it isn’t hard to convince some people that their carbon sins will lead to hell fire.
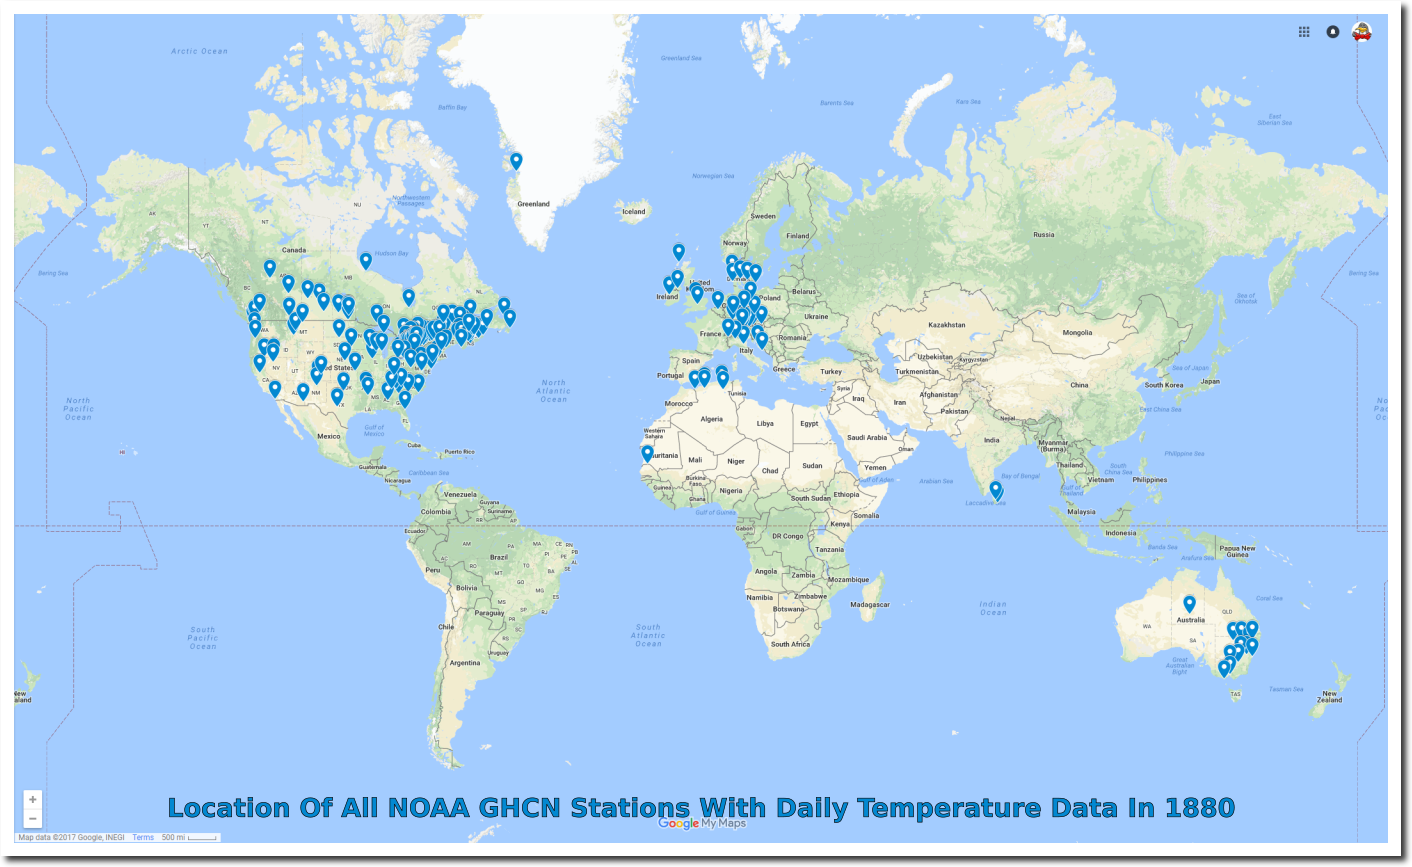
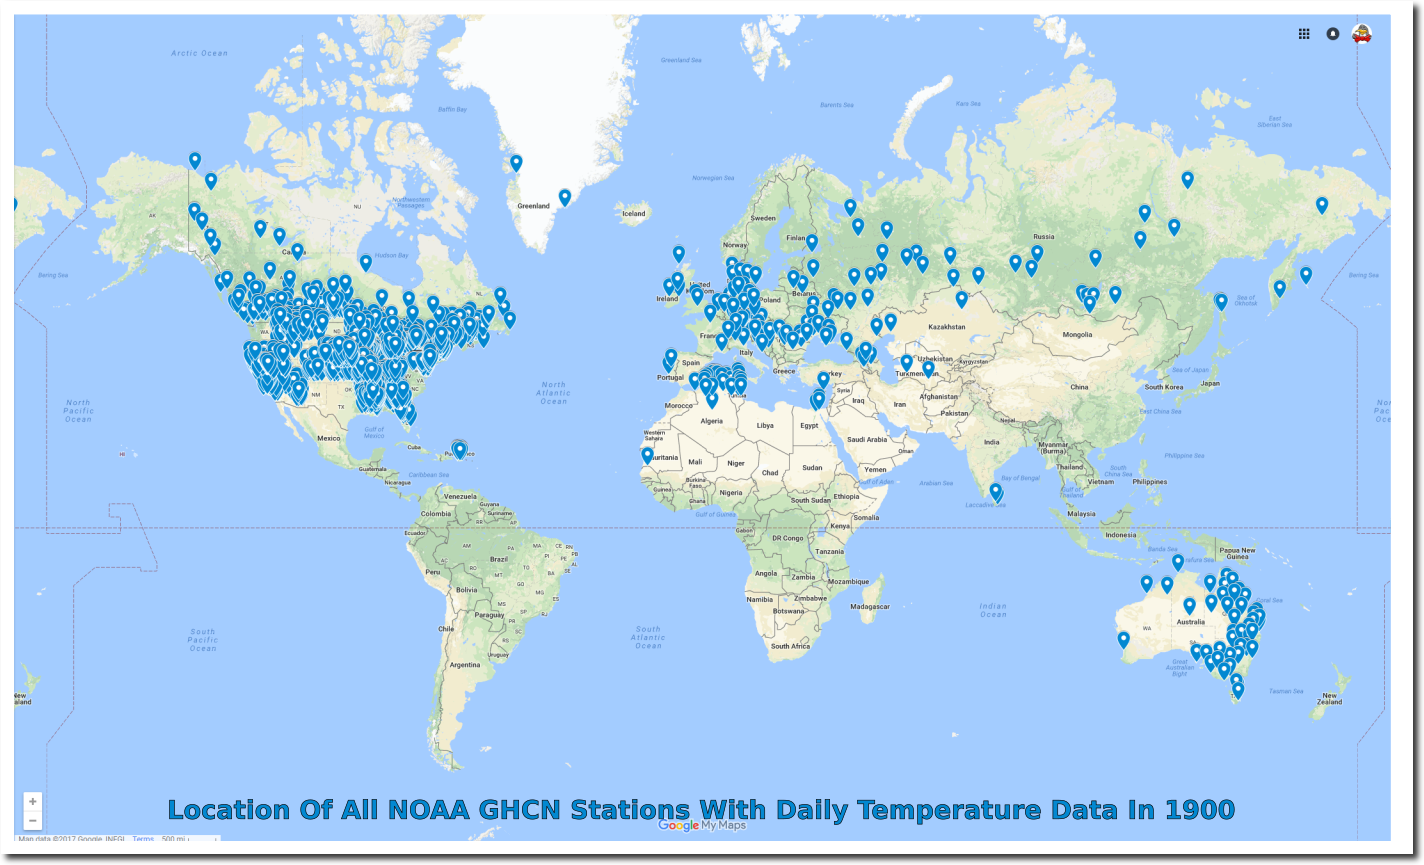
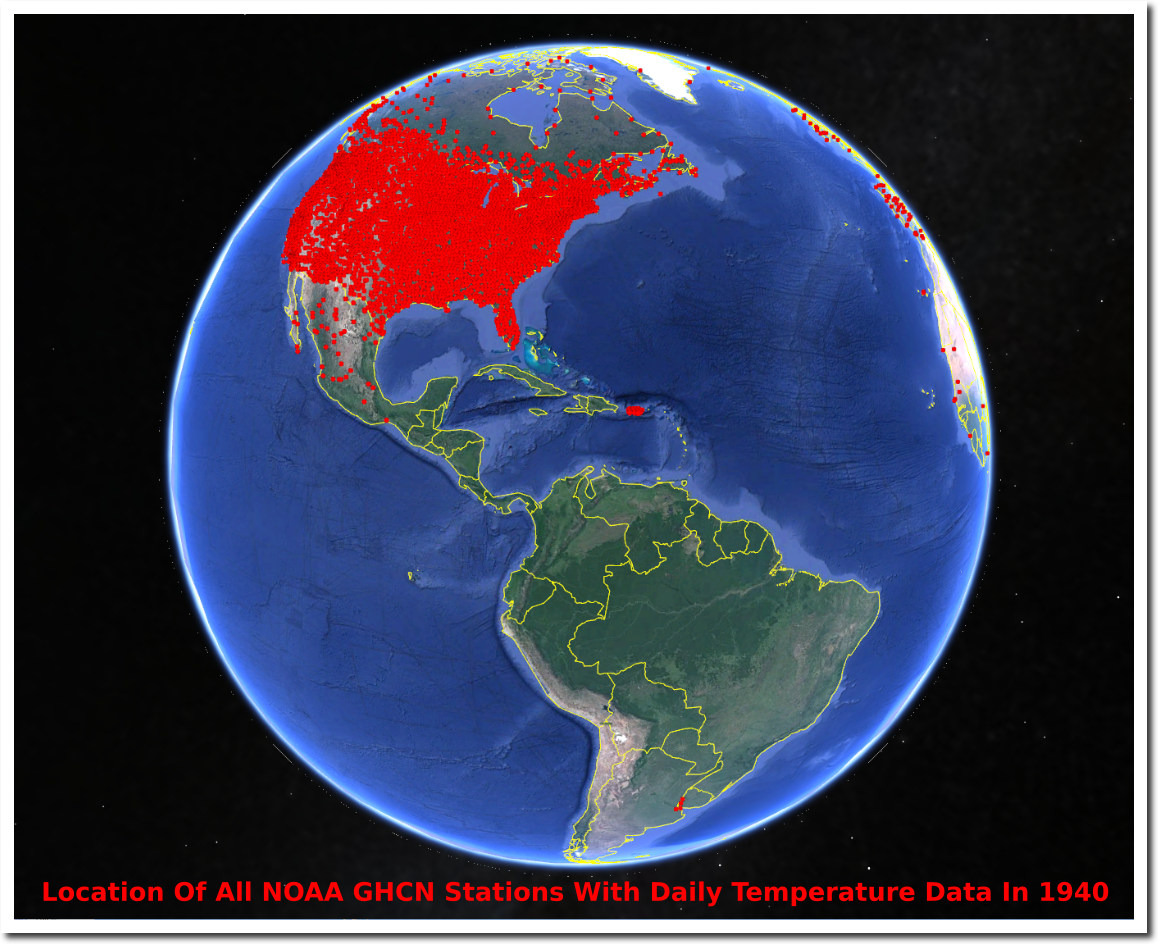
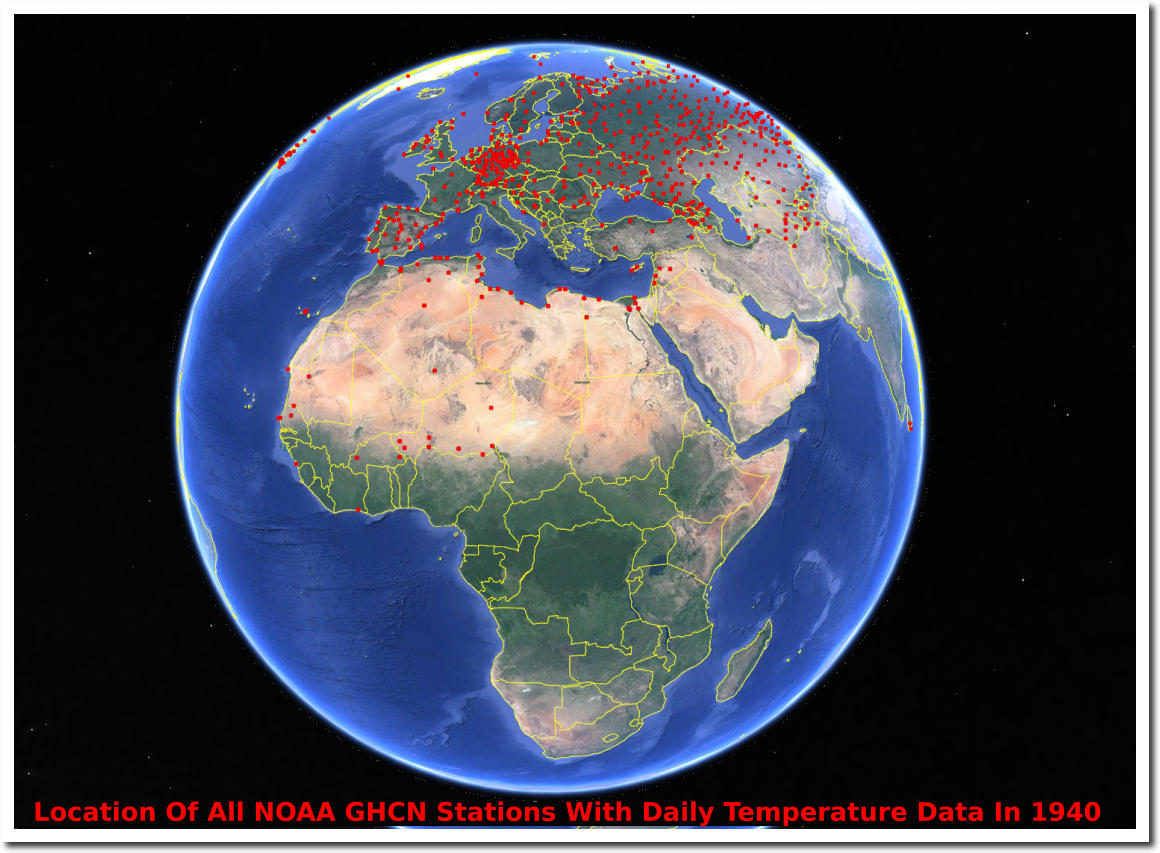
What they aren’t telling is that their graph and map are fake. They have no idea what global temperatures were in 1880, 1900, 1920, 1940, or in fact the present, because outside of the US there is very little verifiable data.
NOAA’s current data in Africa and much of the rest of the world is still fake. They make up record temperatures in countries where they have no thermometer data.
By their own admission, the ocean data is also fake.
date: Wed Apr 15 14:29:03 2009
from: Phil Jones <p.jones@uea.ac.uk> subject: Re: Fwd: Re: contribution to RealClimate.org
to: Thomas Crowley <thomas.crowley@ed.ac.uk>
Tom,
The issue Ray alludes to is that in addition to the issue
of many more drifters providing measurements over the last
5-10 years, the measurements are coming in from places where
we didn’t have much ship data in the past. For much of the SH between 40 and 60S the normals are mostly made up as there is very little ship data there.
All of the claims in the National Climate Assessment about global warming are unsupportable junk science, made largely with fraudulent or imaginary data. Global warming is the biggest scam in science history. It has been thoroughly corrupted by tens of billions of dollars of government money – which fake climate scientists refuse to let go of.
The only thing global and unambiguous in the National Climate Assessment, is the level of junk science and fraud it represents.
“Contrary to expectations, climate scientists continue to report that large regions of the Earth have not been warming in recent decades.”
INTERESTING to see how the warmist community will spin the “science” from these latest inconvenient findings that contradict IPCC climate model predictions and the endless “Hottest Year Evah“ PR claims.
NO doubt, Climate Crisis Inc … and the UN IPCC won’t go near it. And don’t expect to see empirical evidence of globally cooling oceans and thickening glaciers gleefully reported on CNN, BBC or ABC Australia. Any climate news that doesn’t fit the human-caused warming narrative is expressly ignored by the #FakeNews mainstream media, using their favoured and most effective propaganda weapon – confirmation bias.
MORE from Kenneth Richard via Pierre Gosselin’s excellent site NoTricksZone :
Contrary to expectations, climate scientists continue to report that large regions of the Earth have not been warming in recent decades.
According to Dieng et al. (2017), for example, the global oceans underwent a slowdown, a pause, or even a slight cooling trend during 2003 to 2013. This undermines expectations from climate models which presume the increase in radiative forcing from human CO2 emissions should substantially increase ocean temperatures.
The authors indicate that the recent trends in ocean temperatures “may just reflect a 60-year natural cycle“, the AMO (Atlantic Multidecadal Oscillation), and not follow radiative forcing trends.
Dieng et al., 2017 We investigate the global mean and regional change of sea surface and land surface temperature over 2003–2013, using a large number of different data sets, and compare with changes observed over the past few decades (starting in 1950). … While confirming cooling of eastern tropical Pacific during the last decade as reported in several recent studies, our results show that the reduced rate of change of the 2003–2013 time span is a global phenomenon. GMST short-term trends since 1950 computed over successive 11-year windows with 1-year overlap show important decadal variability that highly correlates with 11-year trends of the Atlantic Multidecadal Oscillation index. The GMST 11-year trend distribution is well fitted by a Gaussian function,confirming an unforced origin related to internal climate variability.
We evaluate the time derivative of full-depth ocean heat content to determine the planetary energy imbalance with different approaches: in situ measurements, ocean reanalysis and global sea level budget. For 2003–2013, it amounts to 0.5 +/− 0.1 W m−2, 0.68 +/− 0.1 W m−2 and 0.65 +/− 0.1 W m−2, respectively for the three approaches. Although the uncertainty is quite large because of considerable errors in the climate sensitivity parameter, we find no evidence of decrease in net radiative forcing in the recent years, but rather an increase compared to the previous decades.
We can note that the correlation between GMST [global mean surface temperature] trends and AMO trends is quite high. It amounts 0.88 over the whole time span. At the beginning of the record, the correlation with PDO trends is also high (equal to 0.8) but breaks down after the mid-1980s. The GMST and AMO trends shown in Figure 6 show a low in the 1960s and high in the 1990s, suggestive of a 60-year oscillation, as reported for the global mean sea level by Chambers et al. (2012). Thus the observed temporal evolution of the GMST [global mean surface temperature] trends may just reflect a 60-year natural cycle driven by the AMO.
Subpolar North Atlantic Cooling Rapidly Since 2005
According to Piecuch et al. (2017) there has been no net warming of the North Atlantic Ocean in the last quarter century. The warming that occurred in the 10 years from 1994-2004 has been completely negated by an even more pronounced cooling trend since 2005. The predominant (87%) cause of the warming was determined to be of the same natural (non-anthropogenic) origin as the subsequent cooling: advection, the movement/circulation of heat via internal processes. In fact, human CO2 emissions are never mentioned as even contributing to the the 1994-2004 warming.
Piecuch et al., 2017 The subpolar North Atlantic (SPNA) is subject to strong decadal variability, with implications for surface climate and its predictability. In 2004–2005, SPNA decadal upper ocean and sea-surface temperature trends reversed from warming during 1994–2004 to cooling over 2005–2015. … Over the last two decades, the SPNA has undergone a pronounced climate shift. Decadal OHC and SST trends reversed sign around 2004–2005, with a strong warming seen during 1994–2004 and marked cooling observed over 2005–2015. These trend reversals were pronounced (> 0.1 °C yr−1 in magnitude) in the northeastern North Atlantic (south and west of Iceland) and in the Labrador Sea. … To identify basic processes controlling SPNA thermal variations, we diagnose the SPNA heat budget using ECCOv4. Changes in the heat content of an oceanic control volume can be caused by convergences and divergences of advective, diffusive, and surface heat fluxes within the control volume. [Advective heat convergence] explains 87% of the total [ocean heat content] variance, the former [warming] showing similar decadal behavior to the latter [cooling], increasing over 1994–2004, and decreasing over 2005–2015. … These results demonstrate that the recent SPNA decadal trend reversal was mostly owing to advective convergences by ocean circulation … decadal variability during 1993–2015 is in largest part related to advection by horizontal gyres.
Yeager and Robson (2017) also point out that, like it did from the 1960s to 1980s, the North Atlantic “has again been cooling”, a trend which they and others expect to continue. Sea surface temperatures are no warmer today than they were in the 1950s.
Yeager and Robson, 2017 [W]hile the late twentieth century Atlantic was dominated by NAO-driven THC [thermohaline circulation] variability, other mechanisms may dominate in other time periods. … More recently, the SPNA [sub polar North Atlantic] upper ocean has again been cooling, which is also thought to be related to a slowdown in the THC. A continued near-term cooling of the SPNA has been forecast by a number of prediction systems, with implications for pan-Atlantic climate.
The Southern Ocean Has Been Cooling Since The 1970s, Contrary To Models
Latif et al., 2017 The Southern Ocean featured some remarkable changes during the recent decades. For example, large parts of the Southern Ocean, despite rapidly rising atmospheric greenhouse gas concentrations, depicted a surface cooling since the 1970s, whereas most of the planet has warmed considerably. In contrast, climate models generally simulate Southern Ocean surface warming when driven with observed historical radiative forcing. The mechanisms behind the surface cooling and other prominent changes in the Southern Ocean sector climate during the recent decades, such as expanding sea ice extent, abyssal warming, and CO2 uptake, are still under debate. Observational coverage is sparse, and records are short but rapidly growing, making the Southern Ocean climate system one of the least explored. It is thus difficult to separate current trends from underlying decadal to centennial scale variability.
Turney et al., 2017 Occupying about 14% of the world’s surface, the Southern Ocean plays a fundamental role in ocean and atmosphere circulation, carbon cycling and Antarctic ice-sheet dynamics. … As a result of anomalies in the overlying wind, the surrounding waters are strongly influenced by variations in northward Ekman transport of cold fresh subantarctic surface water and anomalous fluxes of sensible and latent heat at the atmosphere–ocean interface. This has produced a cooling trend since 1979.


Recent Comments