Understanding The “Hottest Year Evah”
Posted: September 8, 2016 | Author: Jamie Spry | Filed under: Climate Fraud, Climatism, Data Tampering, Empirical Evidence, Environmentalists, Fact Check, Gavin Schmidt, Global Temperature, Govt Climate Agenda, Green Agenda, Satellite Data, Scientific Fraud, UAH | Tags: Climate Change Scam, climate fraud, Data Fraud, Data Tampering, Fact Check, Gavin Schmidt, Global Warming, nasa, NOAA, RSS Satellite Data, Satellite Data, UAH satellite data, UHI |
“I believe it is appropriate to have an ‘over-representation’ of the facts
on how dangerous it is, as a predicate for opening up the audience.”
– Al Gore,
Climate Change activist
“No matter if the science of global warming is all phony…
climate change provides the greatest opportunity to
bring about justice and equality in the world.”
– Christine Stewart,
former Canadian Minister of the Environment
“We’ve got to ride this global warming issue.
Even if the theory of global warming is wrong,
we will be doing the right thing in terms of
economic and environmental policy.“
– Timothy Wirth,
President of the UN Foundation
“The Earth has cancer
and the cancer is Man.”
– Club of Rome,
premier environmental think-tank,
consultants to the United Nations

Global Warming activists routinely parrot the infamous “Hottest Year Ever” meme.
However, this depends entirely on which temperature data set is cited:
NASA’s ‘GISS’ temp uses land and ocean-based thermometers which measure “different parts of the system [UHI affected parking lots, asphalt heat sinks, AC exhaust air vents], different signal to noise ratio [we bias toward warm stations], different structural uncertainty [we ‘homogenise’ our data set to cool the past and warm the present to fit the global warming narrative].” – NASA GISS Gavin Schmidt’s admission about the satellite record versus the surface temperature record (square bracket add-ons by Climatism)
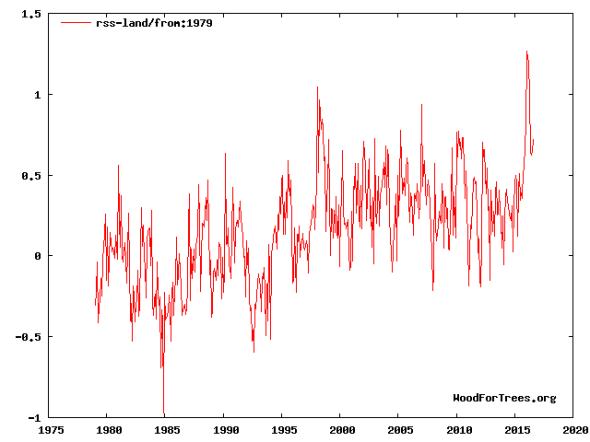
Then there are the much more accurate and comprehensive satellite measurement systems, RSS/UAH, which measure 24/7 the average temperature of every cubic inch of the lower troposphere – the exact place where global warming is meant to occur, according to the theory.
There is a growing divergence between NASA’s (land-based) GISS temp and RSS (lower troposphere) satellite temps since 2000:

Gavin’s New Site | Real Science
The growing divergence between NASA’s GISS and RSS satellite data sets, since 2000, didn’t used to be so stark.
So why the obvious temp divergence, post 2000, after near exact correlation from 1979?
Before 2016 El Niño :

Wood for Trees: Interactive Graphs
Current RSS v GISS :

Wood for Trees: Interactive Graphs
Tony Heller of Real Climate Science, amongst many other heroic climate realists, have spent thousands of unpaid hours explaining why NASA’s data set has been corrupted by 1. UHI and 2. ‘Cooling the past and warming the present.'(data manipulation) to fit the global warming narrative.
UHI (Urban Heat Island effect):
I did a survey of the ten oldest stations in New South Wales And Victoria, circled below. Three rural stations were not included because of obvious problems with the data, but none showed any warming.
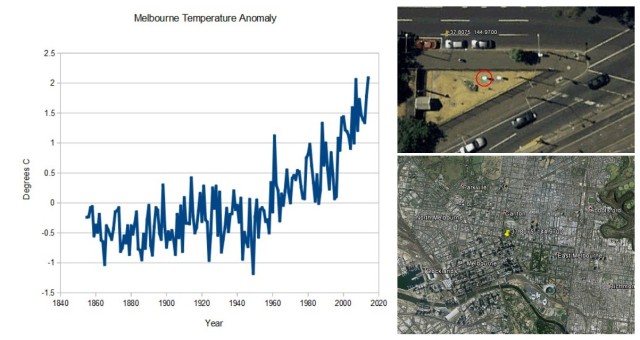
MELBOURNE REGIONAL OFFICE ASN00086071
DENILIQUIN (WILKINSON ST) ASN00074128
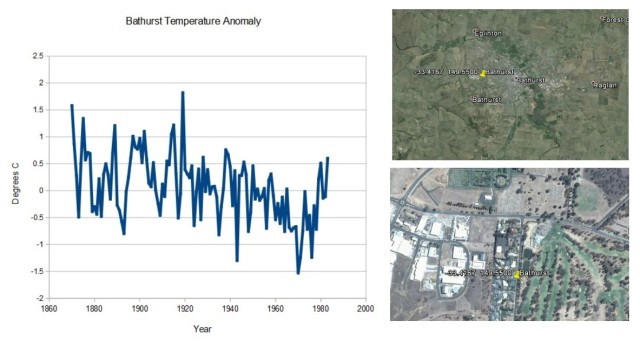
BATHURST GAOL ASN00063004
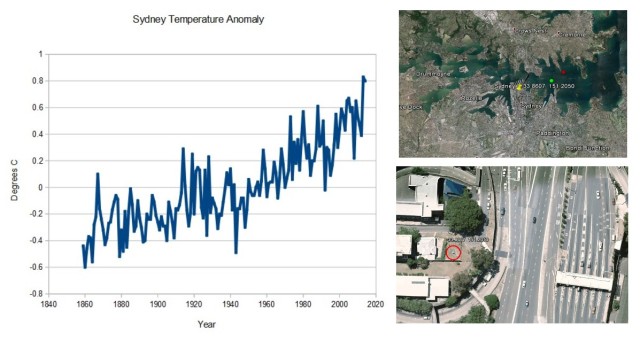
SYDNEY (OBSERVATORY HILL) ASN00066062
CAPE OTWAY LIGHTHOUSE GSN ASN00090015
BOURKE POST OFFICE ASN00048013
WAGGA WAGGA (KOORINGAL) ASN00072151
FORBES (CAMP STREET) ASN00065016
INVERELL COMPARISON ASN00056017
GUNNEDAH POOL ASN00055023
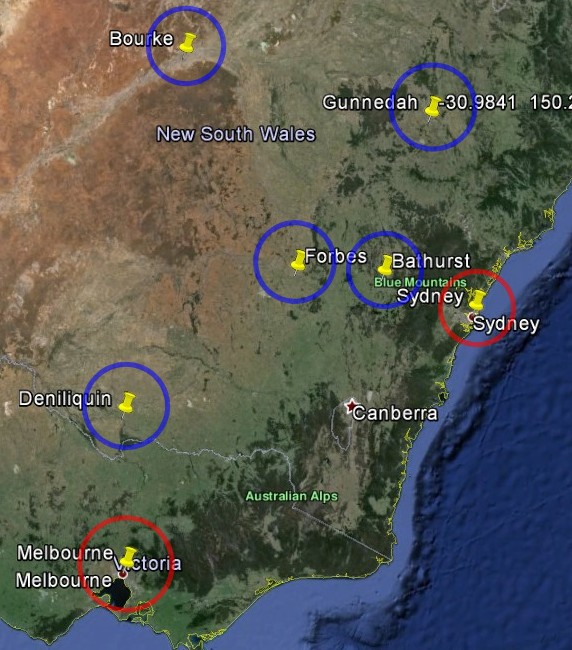
The two urban stations at Melbourne and Sydney both showed strong warming, and both have disastrously poor siting of their thermometers in the middle of large cities.
By contrast, all of the rural stations show a long term cooling trend, with some recent warming. (Note that there is no data for the most recent years with some of the rural stations.)

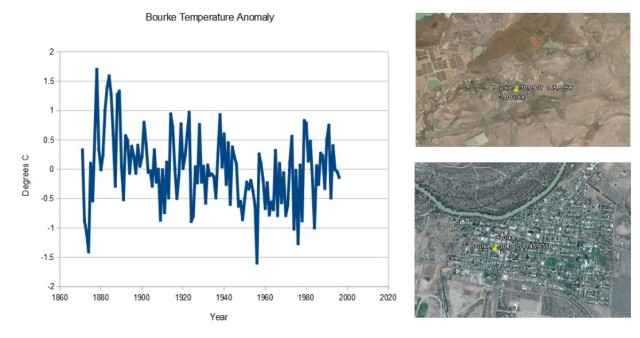
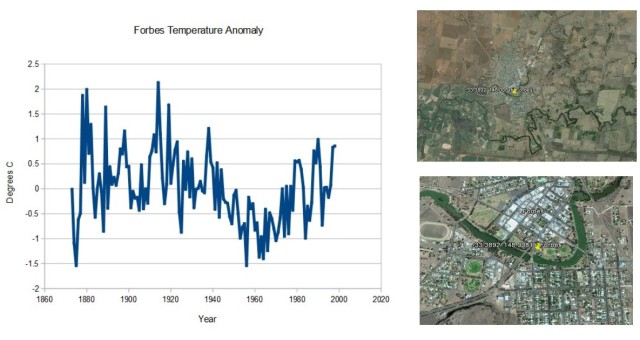
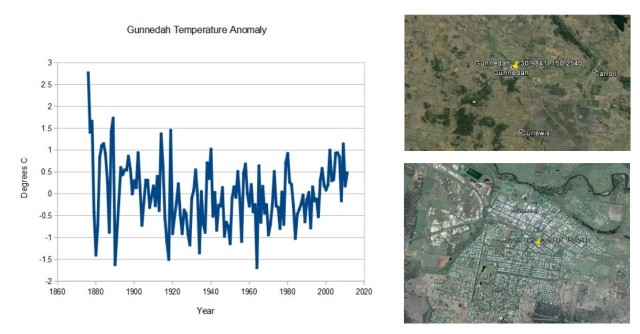
The only conclusion which can be derived from this is that Australia has not warmed long-term, and that BOM claims of record temperatures are due to UHI and/or data tampering.
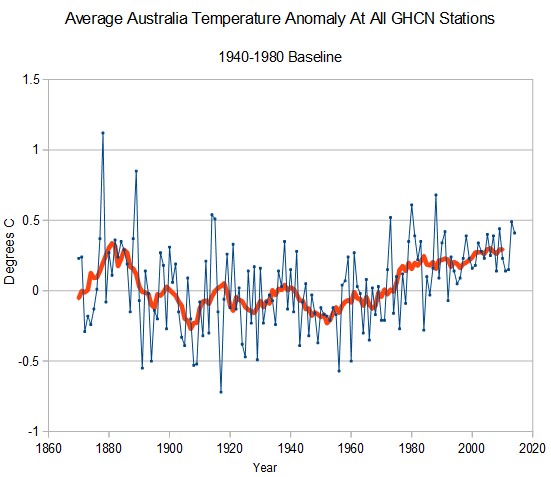
For all GHCN stations in Australia, there is no net warming since 1880
RSS shows no warming in Australia on average since 1979 :

Satellites temperature measurement systems, UAH/RSS, are not polluted with asphalt, car parks, AC exhausts or human development, which is probably why they show no statistically significant global warming, at all, for nearly two decades :

LATEST GLOBAL TEMPS – UAH SATELLITE – ROY SPENCER – Latest Global Temps « Roy Spencer, PhD
Wood for Trees: Interactive Graphs
UPDATE April, 2 2017
Current RSS Satellite temp data…
(Note record temp drop post 2016 El nino. Confirmed by UK Met office.)

Wood for Trees: Interactive Graphs
On the other hand, NASA’s climate change activist-in-chief, Gavin Schmidt’s GISS temp measures; asphalt, car parks, AC exhausts and human development :
From WUWT :
From the “global warming data looks better with heat-sinks and air conditioners” department.
Dr. Mark Albright, of the University of Washington writes:
Here is a great example of how NOT to measure the climate! On our way back to Tucson from Phoenix on Monday we stopped by to see the Picacho 8 SE coop site at Picacho Peak State Park. Note the white MMTS temperature monitor 1/3 of the way in from the left. The building is surrounded by the natural terrain of the Sonoran Desert, but instead the worst possible site adjacent to the paved road and SW facing brick wall was chosen in 2009 as the location to monitor temperature.
Here is a view looking Northeast:

For an aerial view in google maps:
https://www.google.com/maps/place/32°38’45.9%22N+111°24’06.9%22W/@32.6461088,-111.4018201,111m/data=!3m1!1e3!4m2!3m1!1s0x0:0x0?hl=en
The NCEI HOMR metadata repository tells us:
COMPATABLE EQUIPMENT MOVE 55 FEET DUE WEST. EQUIPMENT MOVED 05/06/2009. (that is when the new state park visitor center was built)
http://www.ncdc.noaa.gov/homr/#ncdcstnid=20001376&tab=MISC
Additional photos:

Note the air conditioner heat exchangers within a few feet of the MMTS sensor:


Picacho 8 SE has it all: brick building, parking lot, road, and air conditioner heat exchangers within a few feet of the MMTS sensor.
This one takes the cake, and I think it is worse than our former worst-case USHCN station (now closed) located in a parking lot in Tucson at the University of Arizona:

•••
And here’s the resulting UHI-polluted graph from NASA :

Data.GISS: GISS Surface Temperature Analysis: Analysis Graphs and Plots
•••
Outside of how to accurately measure the earth’s atmosphere to detect the supposed anthropogenic global warming signal, there is a mountain of damning evidence relating to the fraudulent tampering of the global temperature record by climate activist government agencies – NASA and NOAA.
I highly recommend visiting Tony Heller’s site “Real Climate Science” for a comprehensive understanding of the blatant manipulation of NASA’s GISS temp data set to fit the global warming narrative.
Some examples via Tony Heller of NASA ‘cooling the past and warming the present’:
NASA has massively altered their global temperature data over the past 15 years, to double global warming:

A Closer Look At GISS Temperature Fraud | Real Science
The animated image below shows the changes which Dr. Hansen made to the historical US temperature record after the year 1999. He cooled the 1930s, and warmed the 1980s and 1990s. The year 1998 went from being more than half a degree cooler than 1934, to warmer than 1934:

Spectacularly Poor Climate Science At NASA | Real Science
NASA didn’t like the 1940’s warmth in Iceland, so they simply erased it:
The Arctic warming from 1910 to 1940 completely wrecks the alarmist’s story. Fortunately for them, they control the NASA and NOAA data and can tamper with it any way they want to produce data which matches their theory.
They are constantly cooling the past in Iceland, with their latest handiwork shown below.
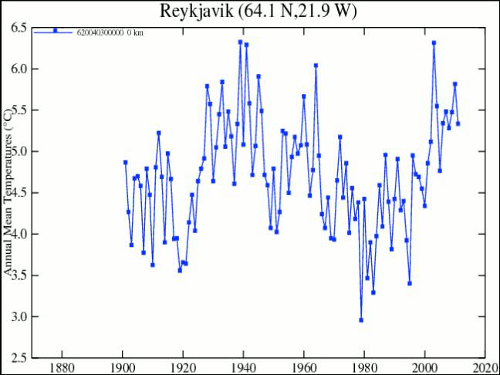
Original version : Data.GISS: GISS Surface Temperature Analysis
Most recent tampering : Data.GISS: GISS Surface Temperature Analysis
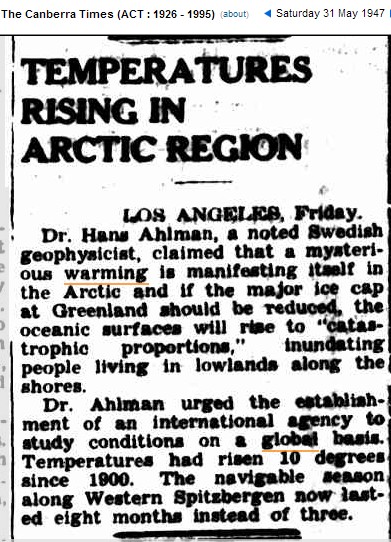
What they can’t tamper with is the written record of eyewitnesses.

18 Feb 1952 – POLAR ICE THAW INCREASING GLACIERS SAID TO [?] M…

31 May 1947 – TEMPERATURES RISING IN ARCTIC REGION LOS ANGELES…
•••
See also :
Related :
NASA Data Fraud Related :
Australia Massaged Adjustment / UHI Related :


[…] trending upwards, and 2017 was amongst the highest on record, despite rising CO2 emissions and the “Hottest Year Evah” […]
LikeLike
[…] Understanding The “Hottest Year Evah” | Climatism […]
LikeLike