
The Pause draws blood – A new record Pause length: no warming for 18 years 7 months
Posted: August 10, 2015 Filed under: AGW, Climate Change, Global Temperature, Global Warming, Global Warming Stasis, Satellite Data | Tags: Climate Change, COP21, Global Warming, RoadToParis, Satellite Data, UN, UNEP, UNFCCC Leave a commentFor the alarmists and hardened global warming believers out there, some pre-information on the atmospheric measurement systems used to measure the presence of ‘man-made’ CO2-induced global warming:
– RSS and UAH satellites measure the lower troposphere – the precise area of the atmosphere where “Global Warming” theory is measured. Alarmists now point to the oceans as the main component of the “Global Warming” system. They do this precisely because the atmosphere has indeed stopped warming, despite the fact that 35% of all human CO2 emissions, since 1751, have been emitted over the past 18 years, with NO atmospheric ‘Global Warming’, at all. A terrible stat for the global warming cult.
– The name ‘Global Warming’ was changed to ‘Climate Change’ when it became obvious the atmosphere had stopped warming. This suits the agenda greatly, as the name ‘Climate Change’ cannot be falsified. The ‘climate’ always changes. Hence, any metric can be used to prove their theory: hot, cold, wet, dry, drought, flood. Therefore as a ‘science’, the theory of “climate change” is a null-hypothesis. i.e pseudo-science.
– Lower tropospheric Satellite temperature data (UAH and RSS) was all the rage in the 1990’s when it ‘was’ warming. Now it is scoffed at by the global warming clique.
– Any adult entering university this year, or next, would have never experienced any ‘Global Warming’ in their entire lives.
By Christopher Monckton of Brenchley
For 223 months, since January 1997, there has been no global warming at all (Fig. 1). This month’s RSS temperature shows the Pause setting a new record at 18 years 7 months.
It is becoming ever more likely that the temperature increase that usually accompanies an El Niño will begin to shorten the Pause somewhat, just in time for the Paris climate summit, though a subsequent La Niña would be likely to bring about a resumption and perhaps even a lengthening of the Pause.

Figure 1. The least-squares linear-regression trend on the RSS satellite monthly global mean surface temperature anomaly dataset shows no global warming for 18 years 7 months since January 1997.
The hiatus period of 18 years 7 months is the farthest back one can go in the RSS satellite temperature record and still show a sub-zero trend. The start date is not…
View original post 4,508 more words
More Mind-Blowing Fraud From The Guardian
Posted: August 10, 2015 Filed under: Uncategorized 1 Comment“Every single claim made by the Guardian is patently false. It is difficult debating criminals who lie, cheat and censor.”
But in the age of eco-worship and “saving the planet”, no lie or alarmist distortion of reality is too much, rather, welcomed by the eco-brainwashed – high on ideology and religious zeal.
Climate Change, Global Warming, Climate disruption or whatever name they come up with next to suit the current ‘climate’, was and never will be about science, discovery or the truth.
Scary times we live in. Really.
Every day, The Guardian pushes fraud to spectacular new levels. Today they claim that warming oceans are melting Greenland “fast”
OMG… Greenland’s ice sheets are melting fast | Environment | The Guardian
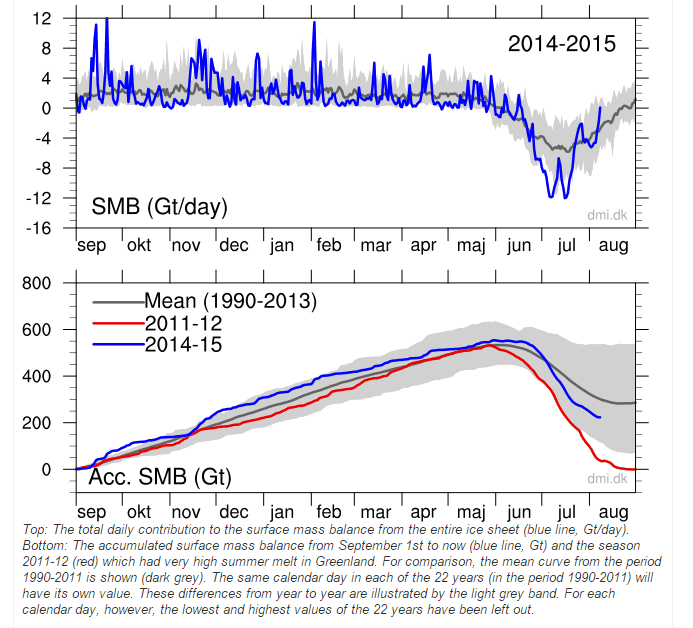
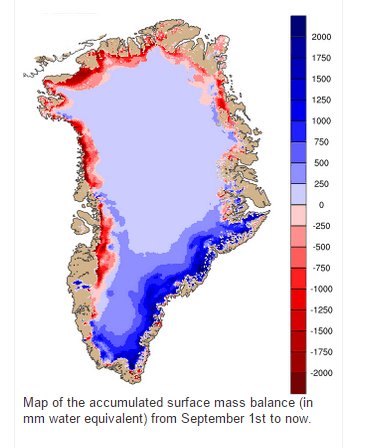
In fact, Greenland’s surface has gained 300 billion tons of ice this year.
Eighty-five percent of the ice sheet has gained mass this year.
Sea surface temperatures in the North Atlantic are about the same as they were in 1870.
Temperatures in the interior of Greenland have gotten nowhere near the melting point this summer.
Scientists on the Greenland ice sheet are getting buried under the ice.
Every single claim made by the Guardian is patently false. It is difficult debating criminals who lie, cheat and censor.
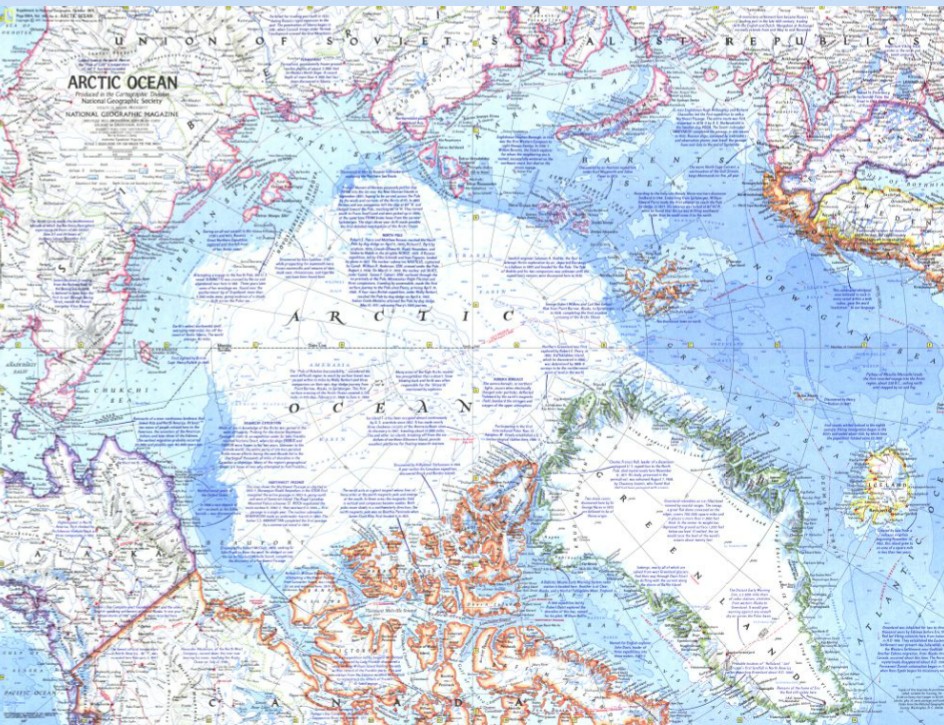
No Change In Arctic Sea Ice Since 1971
Posted: August 10, 2015 Filed under: Uncategorized Leave a commentIf National Geographic blatantly distorts climate data, to promote their agenda, imagine the other distortions of science and data the public is subjected to via other global warming sympathetic media.
The animation below flashes between the 1971 National Geographic Arctic ice map, and the current state of the ice reported by the US Navy.
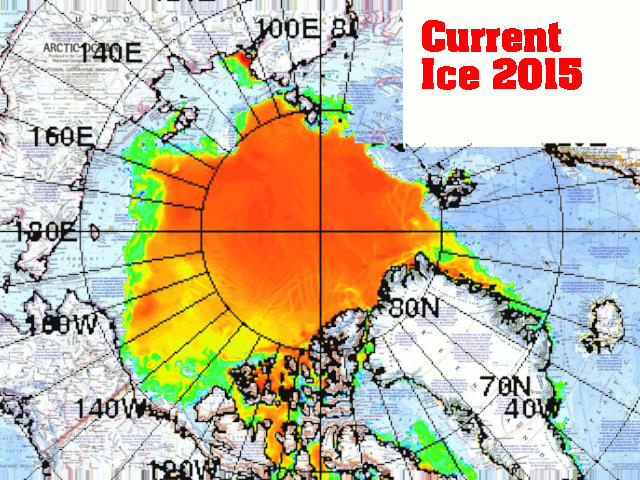
As you can see, the ice edge is nearly identical to 1971, and nothing like the wildly fraudulent map which National Geographic just published.
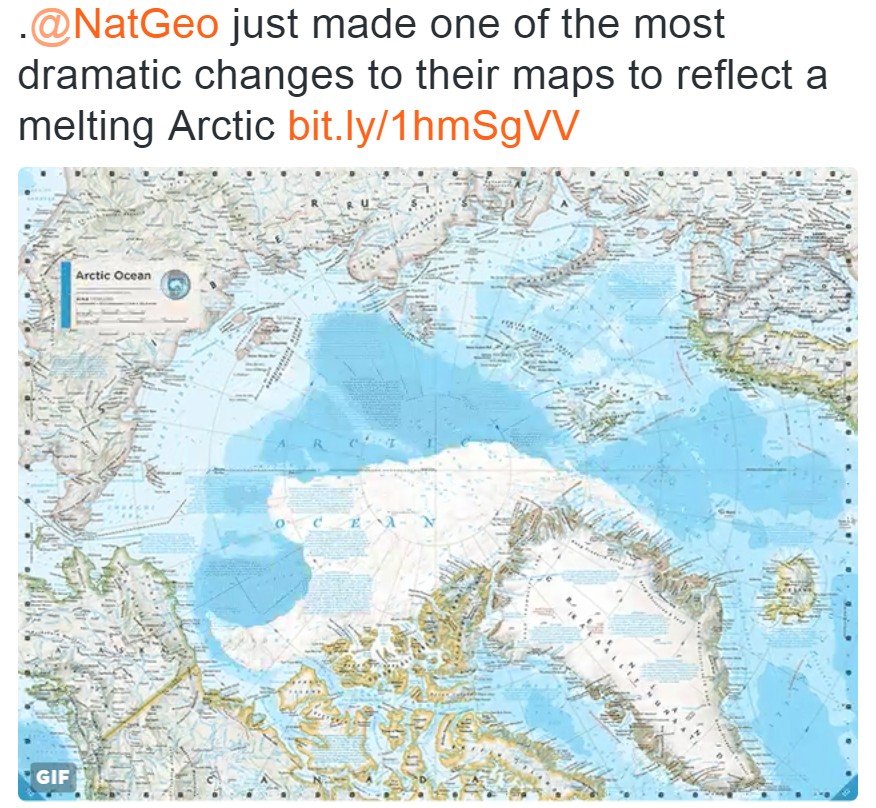
Spectacular Climate Fraud From National Geographic
Posted: August 10, 2015 Filed under: Uncategorized Leave a comment“If the facts don’t fit the theory, change the facts.” – Albert Einstein
Dear Nat Geo, Albert was being sarcastic. He didn’t actually mean for you, NASA, NOAA, NCDC, BoM etc to adjust data to fit your theory.
National Geographic just released this Arctic map, which shows about half as much ice as there actually is.
The real Arctic looks like this – about twice as much ice as the National Geographic Map.

The map below is the 1971 National Geographic ice map – which is nearly identical to the current state of the Arctic.
There seems to be no limit to the level of fraud which formerly respectable magazines will commit, in order to push the “climate change” agenda.


Recent Comments