UNMASKING The Great Arctic Sea-Ice “Death Spiral” Scam
Posted: September 25, 2017 Filed under: Alarmism Debunked, Alarmist media, Arctic, Carbon Dioxide, Climate Fraud, Climate History, Climate science, Climatism, Empirical Evidence, Fact Check, Global Sea Ice | Tags: Alarmist Media, arctic, arctic death spiral, Arctic Sea Ice, Climate Change, Climate Change Scam, Fake News, Global Warming Scam, New York Times, Sea Ice Leave a comment
More scientific evidence that polar bears are doing just fine – a 30% increase in population with some of them “as fat as pigs.”
CONTRARY to popular myth, Arctic sea ice extent is not in a “death spiral“. In fact, there has been no real shrinking of Arctic sea ice in 10 years, which also corresponds to the fact that there has been no statistically significant “global warming” for nearly 20 years.
ALL this despite record “CO2” emissions over the same period, and record hot air bloviated by the trillion dollar climate crisis industry.
THE following is a remarkable post by Tony Heller from his Deplorable Climate Science Blog showing just how corrupt and politicised the “science” of the Arctic has become via the fake-news media and – sadly – from many our most respected scientific institutions including, yes, NASA…
More Spectacular Arctic Fraud At The New York Times
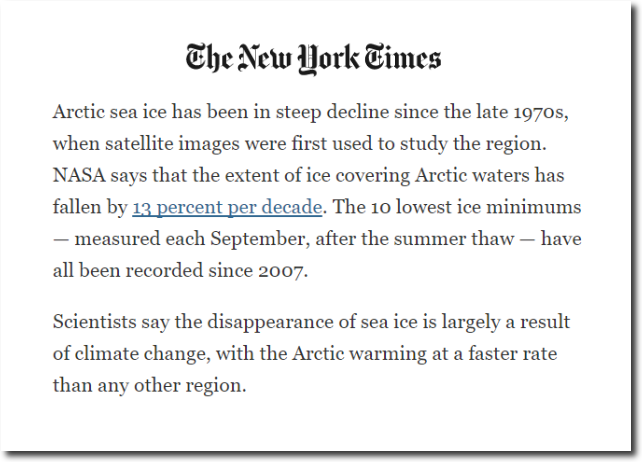
The New York Times just published another fake climate article – this time about the Arctic. They start the article with the claim that satellites were first used to study the Arctic in 1979.

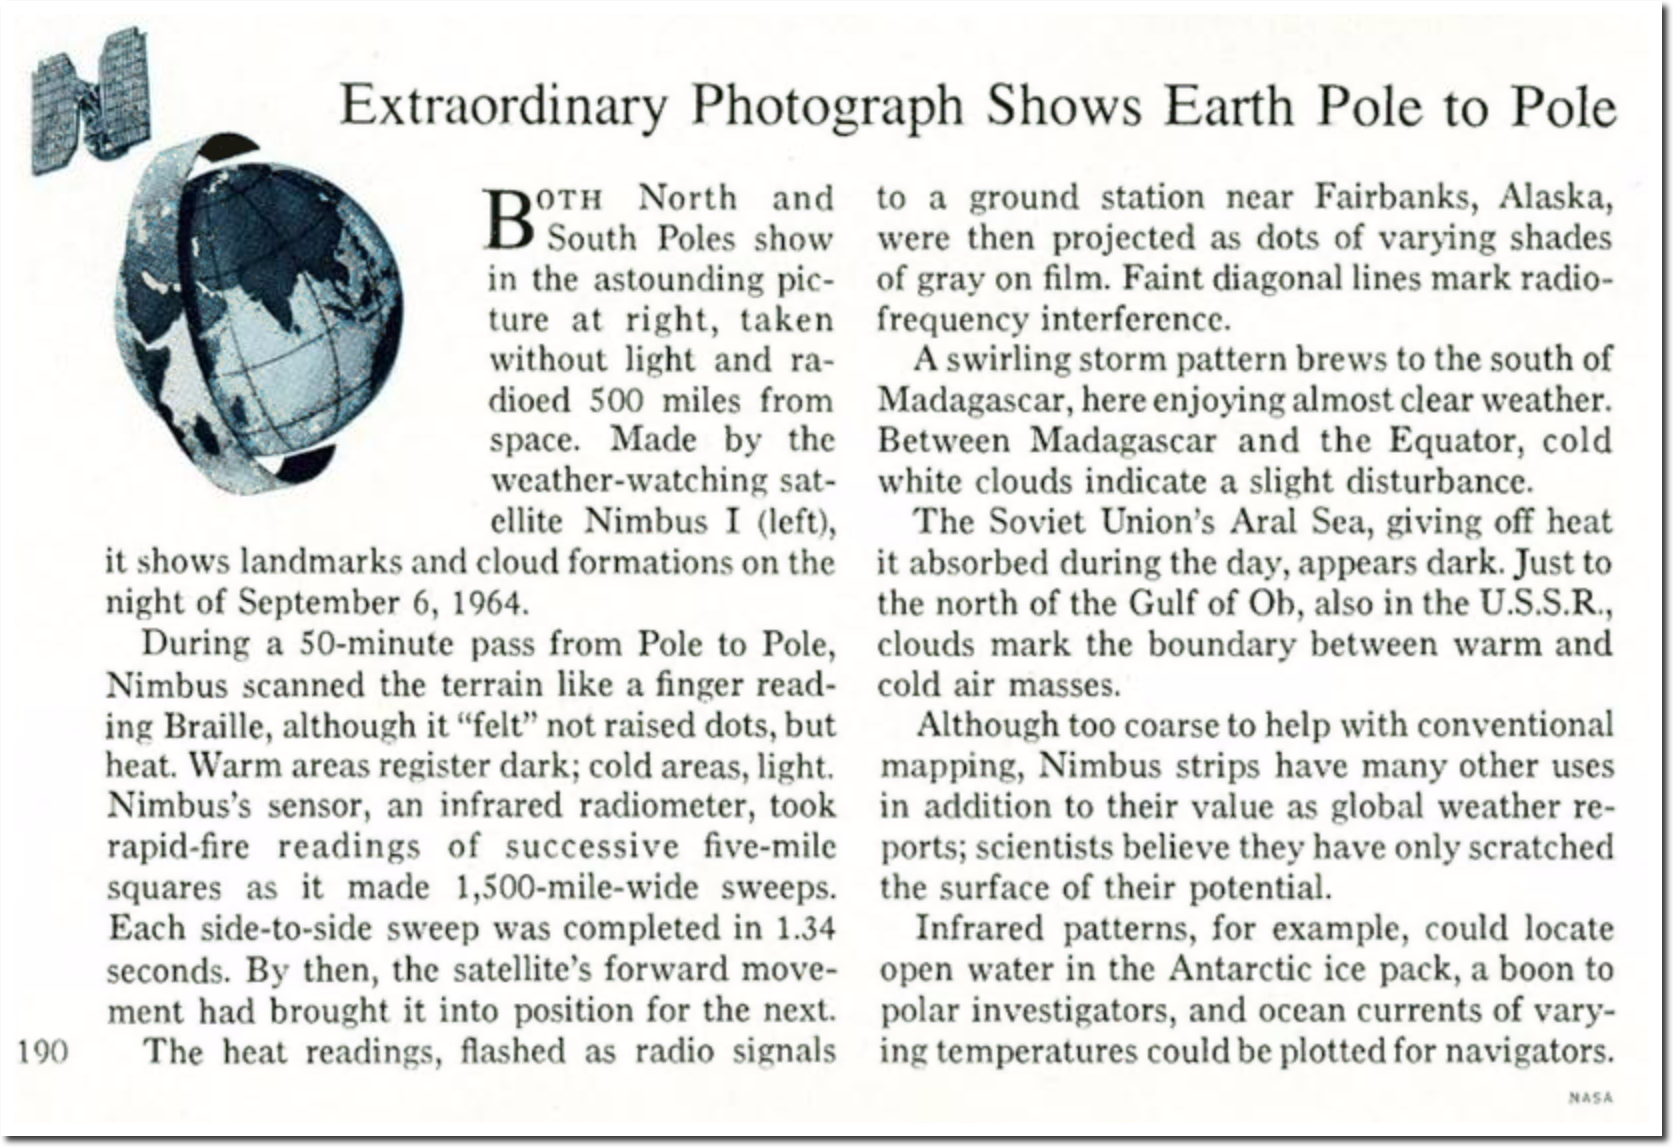
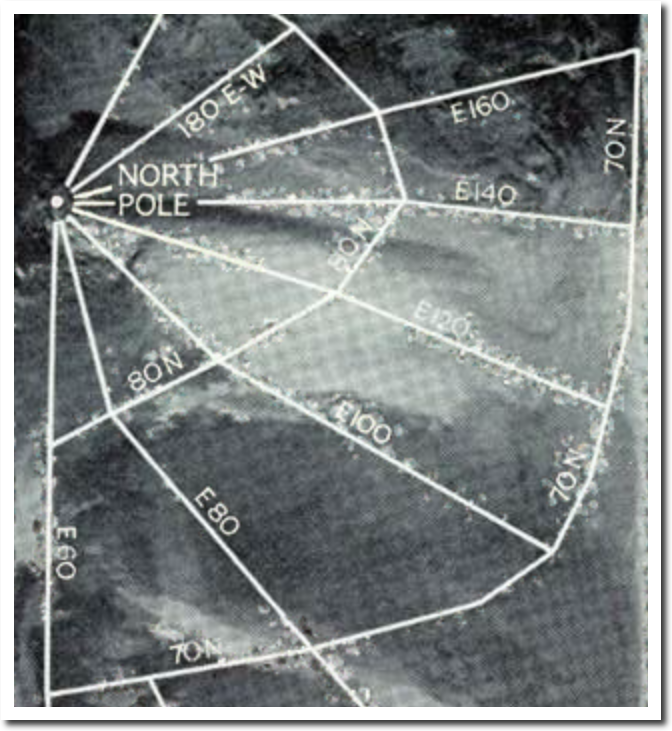
Given that we traveled to the moon in 1969, it is absurd to suggest that satellites weren’t used to study the Arctic before 1979. Here is a 1964 satellite image of the Arctic which was published in National Geographic in 1965.

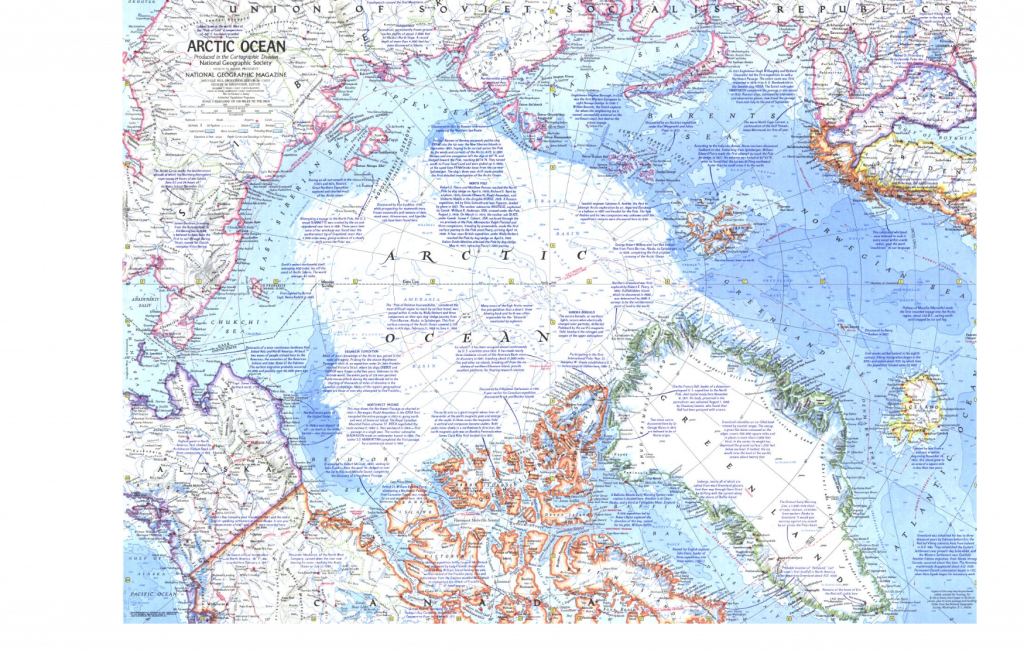
Here is a detailed National Geographic Arctic sea ice map from 1971.
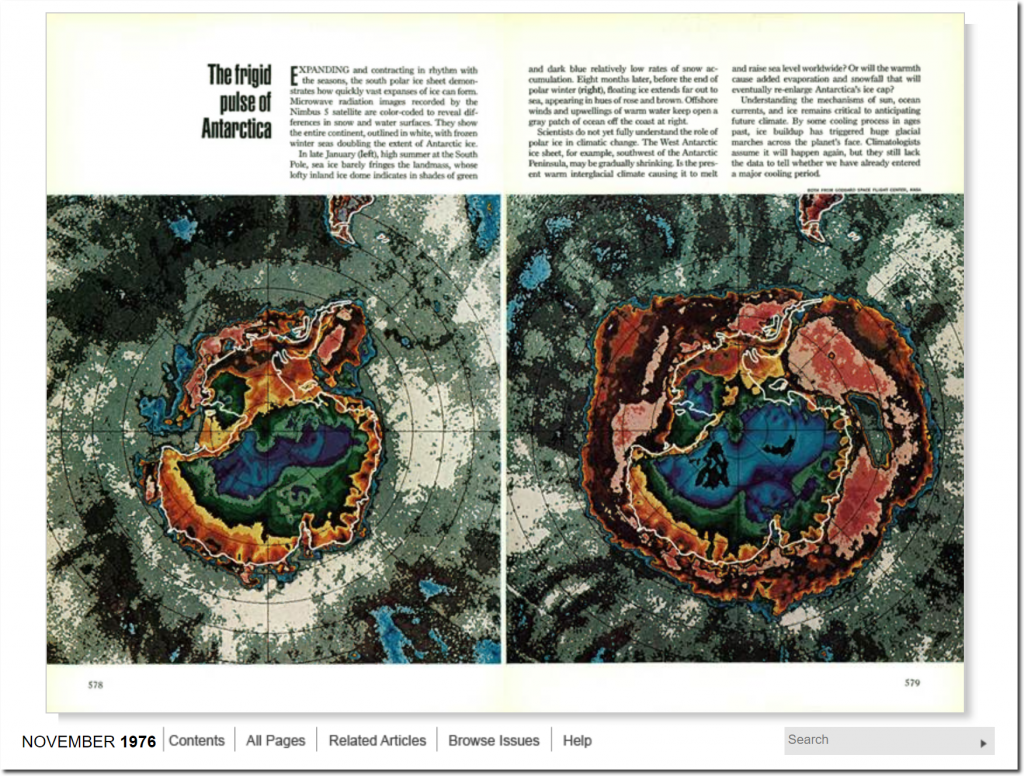
Here is a detailed satellite image of Antarctica from 1976, also published in National Geographic.
The 1990 IPCC report included NOAA Arctic satellite data back to 1973, when it was much lower than 1979.
In a spectacular display of scientific malpractice, NOAA now hides all of the pre-1979 peak Arctic sea ice data. By starting right at the peak, they produce a fake linear downwards trend.
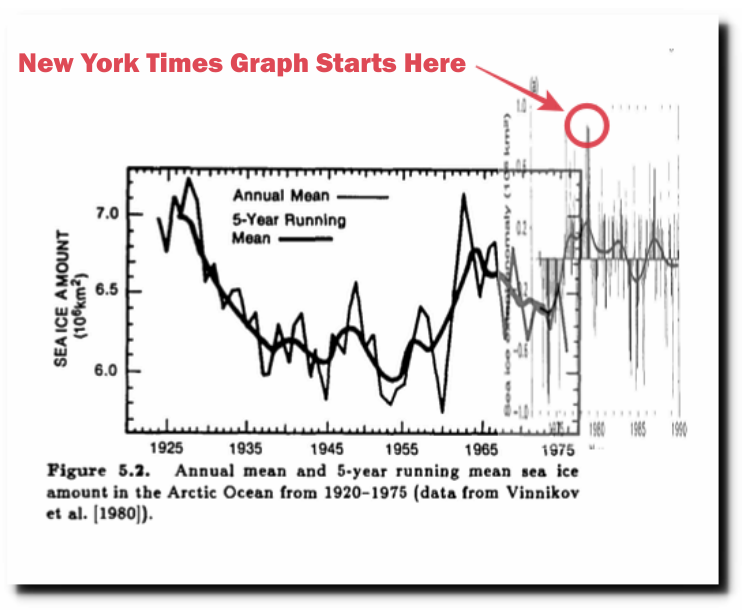
This 1985 DOE climate change report had Arctic data back to 1925, which showed little ice from the 1930s to the 1950s.
So why did the New York Times cherry pick 1979 as their start date? Because it came at the end of three of the coldest US winters on record , and Arctic sea ice was at a century peak. The graph below combines the 1985 DOE graph with the 1990 IPCC graph.
If the New York Times authors had bothered to research their own paper, they could have found this out for themselves. It was very warm in the Arctic in 1958

Three years later, the New York Times reported a unanimous consensus that earth was cooling.

By 1970, the Arctic climate was becoming more frigid, the ice was getting “ominously thicker” – and scientists were worried about a new ice age.
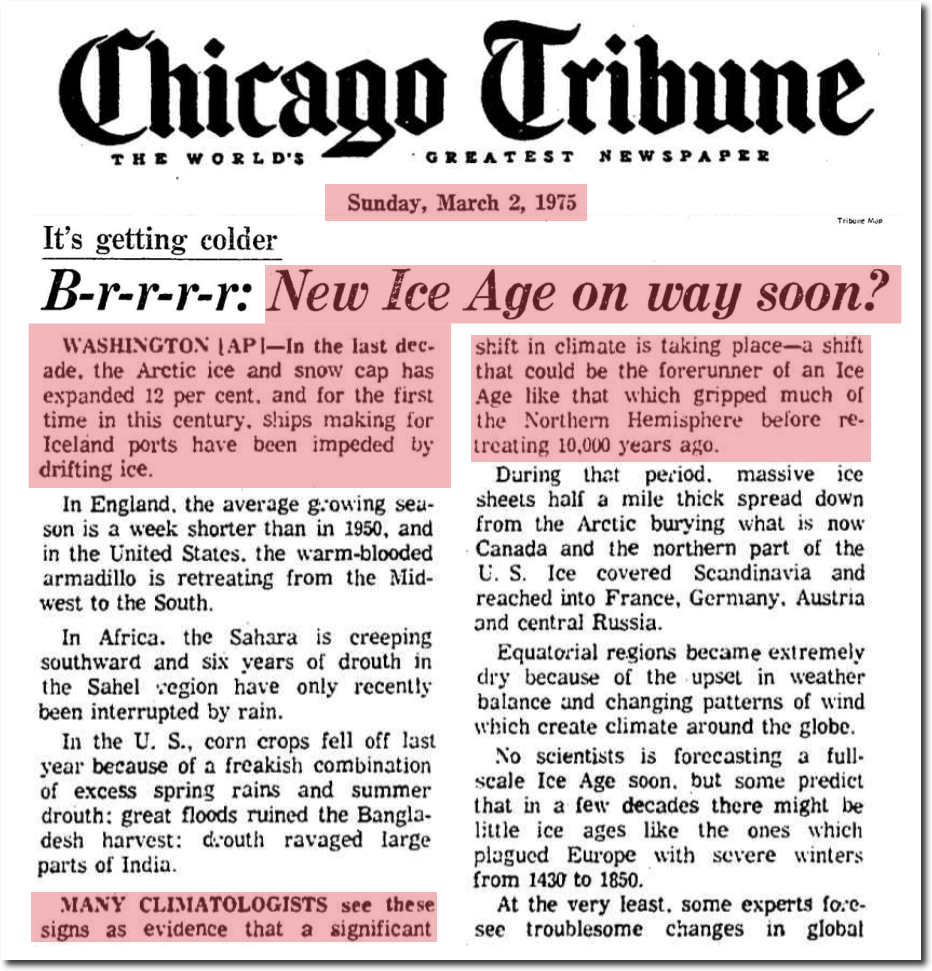
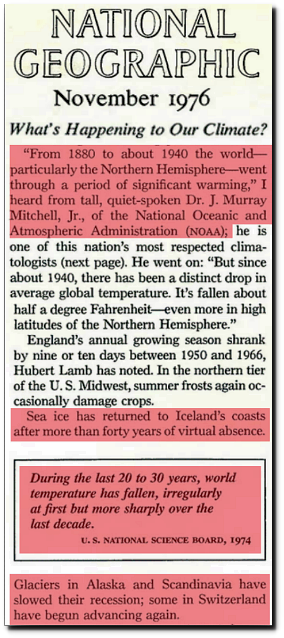
The polar ice cap had expanded 12% by 1975, after shrinking 12% before 1958. Icelandic ports were blocked with ice for the first time in the 20th century.
By hiding all the data before the 1979 peak, the New York Times is defrauding its readers. Arctic climate is cyclical – not linear.
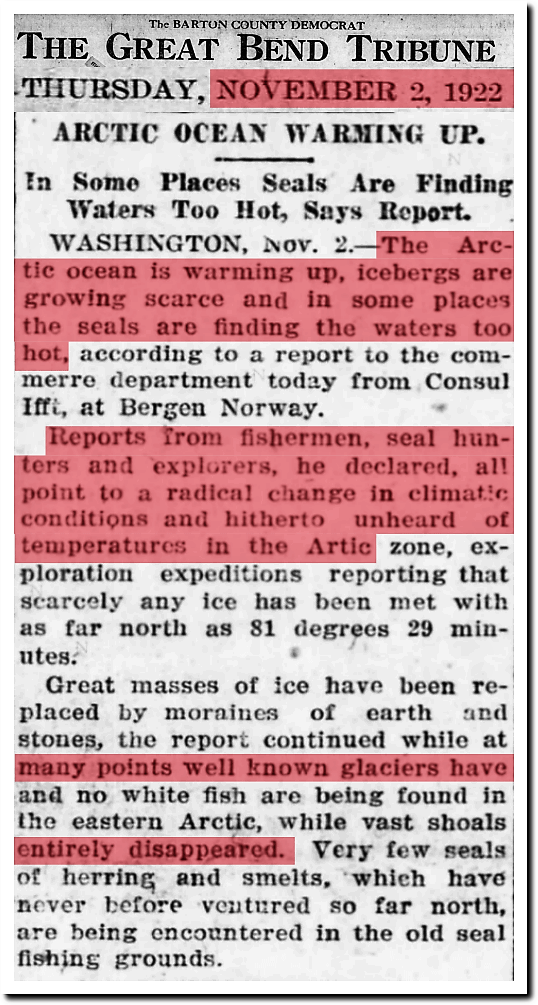
Ninety-five years ago, the Arctic was having a meltdown.
Eighty years ago, the Arctic was having a meltdown.

Sixty five years ago, the Arctic was having a meltdown.
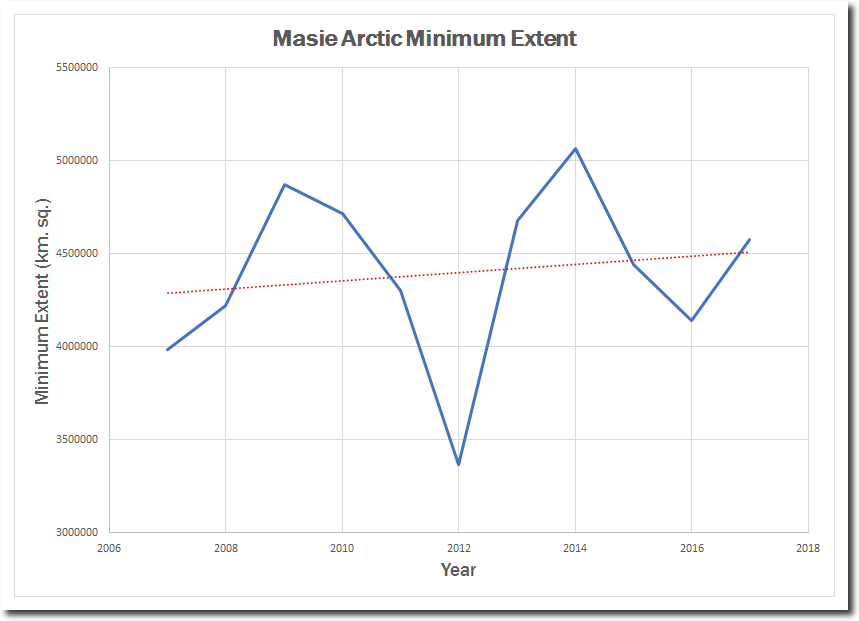
Then the New York Times went on to obscure their graph (below) to hide the fact that there has been a large increase in minimum extent since 2012. Note the “End of summer minimum” label is at the 2012 minimum – not the 2017 minimum.
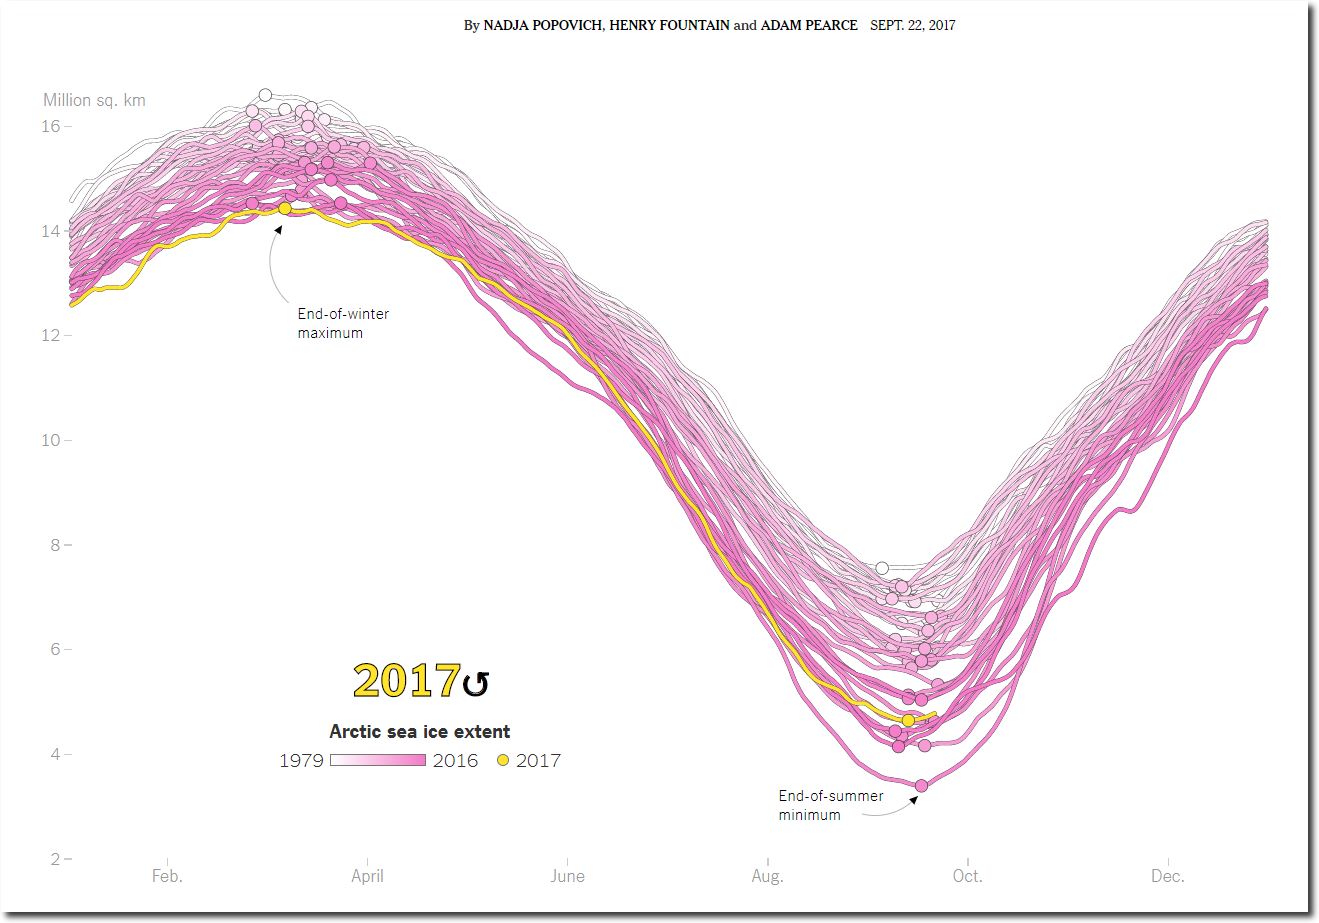
The Arctic minimum extent has been increasing for a decade. The New York Times doesn’t want their readers to know this.
The New York Times is defrauding their readers at many levels. It is the fake news we have learned to expect from them.
More Spectacular Arctic Fraud At The New York Times | The Deplorable Climate Science Blog
***
UPDATE

•••
See also :
- Arctic Full Of Multi-Year Ice | The Deplorable Climate Science Blog
- Astrology And Climate Science | The Deplorable Climate Science Blog
- Little Change In Arctic Sea Ice Since 1971 | The Deplorable Climate Science Blog
- 97% Of Climate “Experts” Promised You The Arctic Would Be Ice-Free By 2014 | Climatism
- 12 New Scientific Papers: Oceans Cooling Globally As Glaciers Thicken | Climatism
- Crooks Still Pursuing Arctic Ice Scam | NOT A LOT OF PEOPLE KNOW THAT
- CLIMATE Alarmism Has Cost Far More Than Any Global Warming Ever Could | Climatism
The Other (Inconvenient) Pole :
- Antarctic Sea Ice Reaches New Record Maximum | NASA
- Record-low 2016 Antarctic sea ice was due to a ‘perfect storm’ of tropical, polar conditions – not ‘climate change’ | Climatism
Global Warming “Pause” Related :
97% Of Climate Scientists Got it Wrong About Effects Of Global Warming, related :
- The global warming backpedalling begins. “It’s less worse than we thought” | Climatism
- Delingpole: Climate Alarmists Finally Admit ‘We Were Wrong About Global Warming’
- How scientists got their global warming sums wrong — and created a £1,000,000,000,000-a-year green industry that bullied experts who dared to question the figures | The Sun UK
- Climate scientists admit they were wrong on climate change effects | Watts Up With That?


Recent Comments