Antarctic Sea Ice Retreats Due To Wind Patterns
Posted: December 15, 2016 Filed under: Uncategorized Leave a comment“It is of course ironic that during the last few years, there have been many attempts to blame increasing Antarctic sea ice on global warming.”
More ice, less ice – it’s all “global warming”.
By Paul Homewood
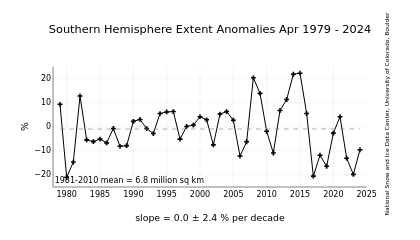
http://nsidc.org/data/seaice_index/
While Arctic ice extent has been at low levels lately, coincidentally, strange things have been going on down under.
Bucking the trend of recent years when Antarctic sea ice extent has been steadily rising, it has dropped away in the last few months.
Naturally this has led to the alarmists having a field day. I have, however, used the word “coincidentally” deliberately, as there is no evidence whatsoever that the Arctic and Antarctic events are connected. Or that the latter has anything to do with global warming.
So what has been happening in the Antarctic? NSIDC offer a clue in their October edition of Arctic Sea Ice News, after it reached winter maximum on a record early date:
View original post 451 more words
Resurging Arctic Ice Dec. 14
Posted: December 15, 2016 Filed under: Uncategorized Leave a comment“In the last 24 days, 2016 ice extent has grown by 123k km2 per day, compared to the 10-year average 79k km2 per day.
“There is no need to panic over Arctic ice this year, or any year. It fluctuates according to its own ocean-ice-atmospheric processes and we can only watch and be surprised since we know so little about how it all works….”

The growth of Arctic ice extent was slower than usual until recently. After showing resilience in September, ending higher than 2007, ice growth lagged in October, but is now rapidly ramping up toward the averages. The map above shows the lack of ice is mainly in Hudson Bay and Barents Sea. Kara, Bering and Chukchi seas have all rebounded and everything else is locked in ice.

In the last 24 days, 2016 ice extent has grown by 123k km2 per day, compared to the 10-year average 79k km2 per day. As of day 348, 2016 ice extent is ~3% less than average (2006 to 2015). The chart also shows the variability of ice extent over the years during this season. 2015 was the highest ice recovery rate in the last decade, while 2007 was the slowest. The chart also shows Sea Ice Index (SII) from NOAA has been lagging behind by more than…
View original post 250 more words


Recent Comments